Home
Class 14
MATHS
Average number of tigers in all Wildlife...


Average number of tigers in all Wildlife preserves in 2016 is how much less/more than aveage number of tiger in all Wildlife preservs in 2000 ?

A

14

B

24

C

18

D

20

Text Solution

Verified by Experts

The correct Answer is:
B

Tota number of tigers in 2016
`=54+75+48+72=252`
Total number of tigers in 2000
`=96+60+72+120=348`
Required difference `=(348)/(4)-(252)/(4)=(96)/(4)=24`
Promotional Banner

Topper's Solved these Questions

  • AREA AND PERIMETER

    IBPS & SBI PREVIOUS YEAR PAPER|Exercise MCQ|75 Videos
  • DATA SUFFICIENCY AND DATA ANALYSIS

    IBPS & SBI PREVIOUS YEAR PAPER|Exercise Multiple choice question|126 Videos

Similar Questions

Explore conceptually related problems

Number of tigers in Wildlife preserve M and N togeter in 2016 is how much more/less than number of tigers in Wildlife preserve L and O together in 2000 ?

Number of tigers in Wildlife preserve 'P' in 2016 is 40% more than number of tigersin Wildlife preserve 'O' in 2000 while number of tigersin Wildlife preserve 'P' in 2000 is 25% less thn number of tigers in Wildlife preserve 'N' in 2016. find total number of tigers in Wildlife preserve 'P' in 2000 and 2016 together ?

Find the ratio between number of tigers in Wildlife preserve 'L' in 2016 to number of tigers in Wildlife preserve 'M' in 2000 ?

Total number of officers in company 'P' is how much less than total number of officers in company 'Q' ?

Total number of Boys working in all six is how much more/less than total number of Girls working in all six years togther ?

Average number of Girls working in 2016 , 2017 and 2018 together is how much more/less than average number of Boys working in 2013,2016 and 2018 together

The Bar graph shown below presents the number of employess in an office during consecutive years. The number of employess in year Y2 is how much percent less than average number of employees per year?

Total number of employees in company 'Q' is how much more than total number of employees in company R,

IBPS & SBI PREVIOUS YEAR PAPER-DATA INTERPRETATION AND CASELETS-QUESTIONS
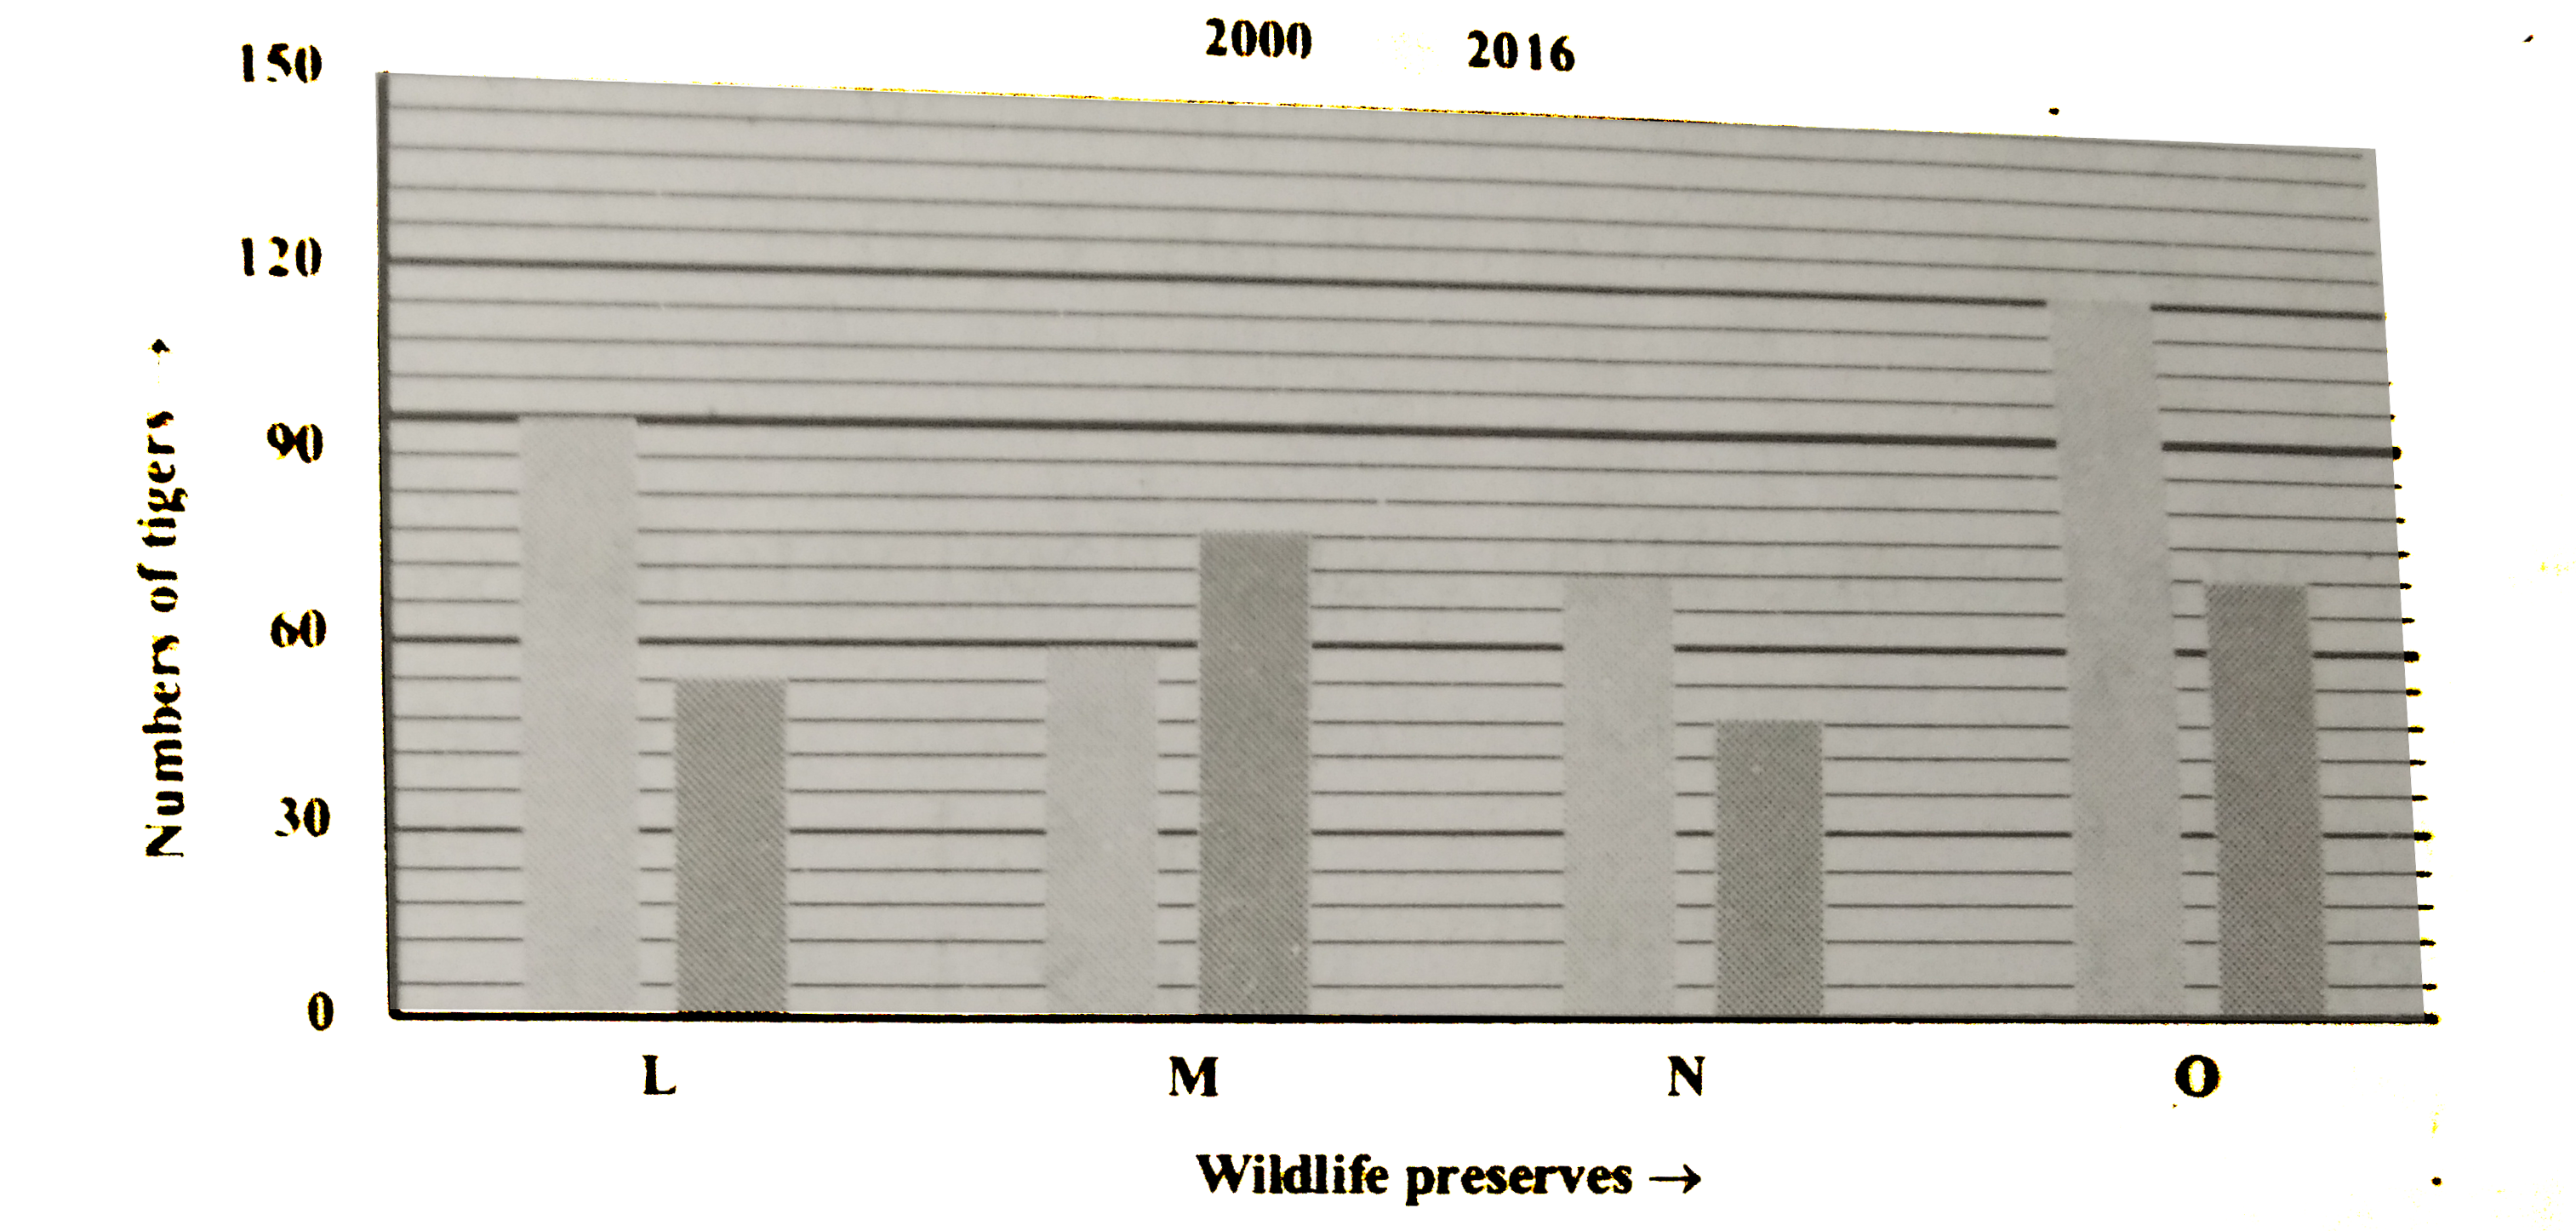
  1. Find the ratio between number of tigers in Wildlife preserve 'L' in 20...

    Text Solution

    |

  2. Number of tigers in Wildlife preserve 'P' in 2016 is 40% more than num...

    Text Solution

    |

  3. Average number of tigers in all Wildlife preserves in 2016 is how much...

    Text Solution

    |

  4. What is the cost flooring of A

    Text Solution

    |

  5. What is thedifference between the cost of fencing of C and that of B ?

    Text Solution

    |

  6. What is the ratio of cost of flooring to that of facting of field D ?

    Text Solution

    |

  7. The cost of fencing of fild E is approximately what percent of the cos...

    Text Solution

    |

  8. The cost of fencing of field C is what percent of the cost of flooring...

    Text Solution

    |

  9. Percentage break up of tourist who visited across various states of In...

    Text Solution

    |

  10. Percentage break up of tourist who visited across various states of In...

    Text Solution

    |

  11. Percentage break up of tourist who visited across various states of In...

    Text Solution

    |

  12. Percentage break up of tourist who visited across various states of In...

    Text Solution

    |

  13. Percentage break up of tourist who visited across various states of In...

    Text Solution

    |

  14. Krishan distributed 10-acre land to Gopal and Ram who paid him the tot...

    Text Solution

    |

  15. Krishan distributed 10-acre land to Gopal and Ram who paid him the tot...

    Text Solution

    |

  16. Krishan distributed 10-acre land to Gopal and Ram who paid him the tot...

    Text Solution

    |

  17. In a certain Business, the profit is 220% of the cost. If the cost inc...

    Text Solution

    |

  18. Krishan distributed 10-acre land to Gopal and Ram who paid him the tot...

    Text Solution

    |

  19. The bar graph below shows the percentage break-up of the number of stu...

    Text Solution

    |

  20. The bar graph below shows the percentage break-up of the number of stu...

    Text Solution

    |