


RD SHARMA-DATA HANDLING-III (PIE CHARTS OR CIRCLE GRAPHS)-All Questions
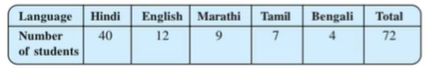
- The number of students in a hostel, speaking different languages is ...
Text Solution
|
- In the month of July 2004, a house holder spent his monthly salary ...
Text Solution
|
- The number of students admitted in different faculties of a college...
Text Solution
|
- Draw a pie-diagram to represent the following data on the proposed ...
Text Solution
|
- The following data relates to the cost of construction of a house i...
Text Solution
|
- Draw a pie-diagram for the following data of expenditure pattern in ...
Text Solution
|
- The following data shows the number of students opting different su...
Text Solution
|
- The number of hours, spent by a school boy on different activities ...
Text Solution
|
- Employees of a company have been categorized according to their rel...
Text Solution
|
- In one day the sales (in rupees) of different items of a baker’s sh...
Text Solution
|
- The following data shows the expenditure of a person on different i...
Text Solution
|
- The percentages of various categories of workers in a state are giv...
Text Solution
|
- The following table shows the expenditure incurred by a publisher i...
Text Solution
|
- Percentage of the different products of a village in a particular d...
Text Solution
|
- Draw a pie-diagram for the following data of expenditure pattern i...
Text Solution
|
- Draw a pie-diagram of the area of continents of the world given in ...
Text Solution
|
- The following data gives the amount spent on the construction of a ...
Text Solution
|
- The following table shows how a student spends his pocket money dur...
Text Solution
|
- Following data gives the break up of the cost of production of a bo...
Text Solution
|
- Represent the following data with the help of a pie-diagram: Items,...
Text Solution
|