Home
Class 8
MATHS
The following pie-chart shows the number...

The following pie-chart shows the number of students admitted in different feculties of a college. If 1000 students are admitted in Science answer the following: What is the total number of students? What is the ratio of students in science and arts?

Promotional Banner

Topper's Solved these Questions

  • DATA HANDLING-II (HISTOGRAMS)

    RD SHARMA|Exercise All Questions|14 Videos
  • DATA HANDLING-IV (PROBABILITY)

    RD SHARMA|Exercise All Questions|38 Videos

Similar Questions

Explore conceptually related problems

Direction :- The following pie-chart shows the number of students who failed in different subjects in an examination. Examine the chart and answer the following questions. The total number of students who have failed is 500. The number of students failed in Science is less than the number of student failed in all other subects by

The following pie-chart shows the number of students who failed in different subjects in an examination. Examine the chart and answer the following questions. The total number of students who have failed is 500. The number of students failed in science is less than the number of students failed in all other subjects by :

The following pie-chart shows the number of students who failed in different subjects in an examination. Examine the chart and answer the following questions. The total number of students who have failed is 500. The central angle of the sector for the students who have failed in mathematics is :

The following piechart shows the number of students who failed in different subjects in an examination. Examine the chart and answer the questions 5 to the total number of students who have failed is 500. Total number of students who did not qualify in Mathematics or Language or Science, is

In a college 40% students are graduates. If the number of graduates is 7000, then what are the total number of students in the college?

The pie chart given below shows the number of students in 6 different sections. The total number of students is 1800. What is the difference between the number of students in section F to the number of students in section C?

RD SHARMA-DATA HANDLING-III (PIE CHARTS OR CIRCLE GRAPHS)-All Questions
  1. The following table shows the expenditure incurred by a publisher i...

    Text Solution

    |

  2. Percentage of the different products of a village in a particular d...

    Text Solution

    |

  3. Draw  a pie-diagram for the following data of expenditure pattern i...

    Text Solution

    |

  4. Draw a pie-diagram of the area of continents of the world given in ...

    Text Solution

    |

  5. The following data gives the amount spent on the construction of a ...

    Text Solution

    |

  6. The following table shows how a student spends his pocket money dur...

    Text Solution

    |

  7. Following data gives the break up of the cost of production of a bo...

    Text Solution

    |

  8. Represent the following data with the help of a pie-diagram: Items,...

    Text Solution

    |

  9. Draw a pie-diagram representing the relative frequencies (expressed...

    Text Solution

    |

  10. Following is the break up of the expenditure of a family on differe...

    Text Solution

    |

  11. Draw a pie-diagram for the following data of the investment pattern...

    Text Solution

    |

  12. The pie chart, given here, represents the number of valid votes obtain...

    Text Solution

    |

  13. The following pie-chart gives the marks scored in an examination by ...

    Text Solution

    |

  14. The following pie-chart shows the monthly expenditure of a family on...

    Text Solution

    |

  15. The pie-chart given in Figure represents the expenditure on differen...

    Text Solution

    |

  16. The pie-chart given in Figure shows the annual agricultural producti...

    Text Solution

    |

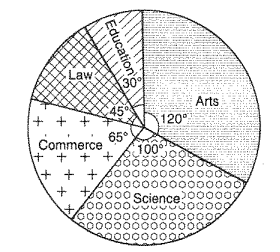
  17. The following pie-chart shows the number of students admitted in dif...

    Text Solution

    |

  18. In Figure, the pie-chart shows the marks obtained by a student in an...

    Text Solution

    |

  19. In Figure, the pie-chart shows the marks obtained by a student in va...

    Text Solution

    |

  20. The following pie-chart shows the monthly expenditure of Shikha on v...

    Text Solution

    |