Home
Class 8
MATHS
Given below is the temperature chart of ...

Given below is the temperature chart of a patient.

Find the temperature of the patient at 12:00 hours and 18:00 hours.
At what time is the temperature (ii) highest? (ii) lowest?

Promotional Banner

Topper's Solved these Questions

  • FACTORISATION

    RD SHARMA|Exercise All Questions|98 Videos
  • LINEAR EQUATION IN ONE VARIABLE

    RD SHARMA|Exercise All Questions|107 Videos

Similar Questions

Explore conceptually related problems

Observe the graph and answer the following questions. The temperature of the patient at 11.00 hours is

Observe the graph and answer the following questions. The temperature of the patient at 15: 00 hours is

The given figure represents the thermometer with which a doctor has just measured the temperature of a patient. What is the temperature of the body of the patient? What is the temperature of the body of the patient?

In the morning the temperature of Delhi was 29^(@)C .After 3 hours it was 4^(@) C warmer.What was the temperature at that time?

In countries like USA and Canada, temperature is measured in Fahrenheit, whereas in countries like India, it is measured in Celsius. Here is a linear equation that converts Fahrenheit to Celsius: F=(9/5)C+32 (i) Draw the graph of the linear equation above using Celsius for x-axis and Fahrenheit for y-axis. (ii) If the temperature is 30°C, what is the temperature in Fahrenheit? (iii) If the temperature is 95°F, what is the temperature in Celsius? (iv) If the temperature is 0°C, what is the temperature in Fahrenheit and if the temperature is 0°F, what is the temperature in Celsius? (v) Is there a temperature which is numerically the same in both Fahrenheit and Celsius? If yes, find it.

The table given below shows the temperatures recorded on a day at different times. Observe the table and answer the following questions. (a) What is the temperature at 8 am? (b) At what time is the temperature 3^(@)C? (c) During which hour did the temperature fall? (d) What is the change in temperature between 7 am and 10 am? (e) During which hour was there a constant temperature?

The linear equation that converts Fahrenheit (F) to Celsius (C ) is given by the relation, C=(5F-160)/(9) . (i) If the temperature is 86^(@) F , what is the temperature in Celsius ? (ii) If the temperature is 35^(@) C, what is the temperature in Fahrenheit ? (iii) If the temperature is 0^(@) C, what is the temperature in Fahrenheit and if the temperature is 0^(@) F, what is the temperature in Celsius ? (iv) What is the numerical value of the temperature which is same in both the scales ?

RD SHARMA-INTRODUCTION TO GRAPHS-All Questions
  1. Decide which of the following statements is true and which is false....

    Text Solution

    |

  2. Following table gives the temperature at 12:00 noon on seven succes...

    Text Solution

    |

  3. The quantity of petrol filed in a car and the cost of petrol are given...

    Text Solution

    |

  4. The perimeter P and sides of a square are connected by the relation...

    Text Solution

    |

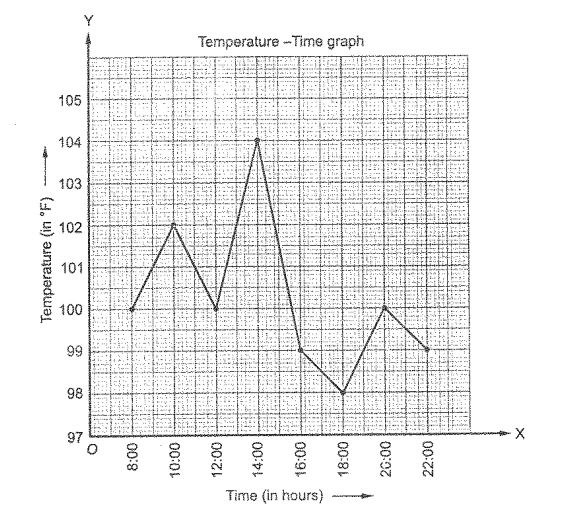
  5. The temperature of patient, admitted in a hospital with typhoid fev...

    Text Solution

    |

  6. A car is going for a long journey of 16 hours, starting at 5:00 hrs. T...

    Text Solution

    |

  7. The sales of a shopkeeper in the first week of January 2002, are given...

    Text Solution

    |

  8. The runs scored by a cricket team in first 10 over are given below: ...

    Text Solution

    |

  9. The maximum temperature on 10 days of June, 2002, in Delhi is given ...

    Text Solution

    |

  10. Given below is the temperature chart of a patient. Find the tem...

    Text Solution

    |

  11. The graph shown in Figure exhibits the rate of interest on fixed dep...

    Text Solution

    |

  12. The following table shows the number of patients discharged from a ...

    Text Solution

    |

  13. The following table shows the amount of rice grown by a farmer in d...

    Text Solution

    |

  14. The following table gives the information regarding the number of p...

    Text Solution

    |

  15. The following table gives the information regarding length of a sid...

    Text Solution

    |

  16. The following table shows the sales of a commodity during the years...

    Text Solution

    |

  17. Draw the temperature-time graph in each of the following cases: Tim...

    Text Solution

    |

  18. Draw the velocity-time graph from the following data: Time (in h...

    Text Solution

    |

  19. The runs scored by a cricket team in first 15 overs are given below: O...

    Text Solution

    |

  20. The runs scored by two teams A\ a n d\ B in first 10 overs are give...

    Text Solution

    |