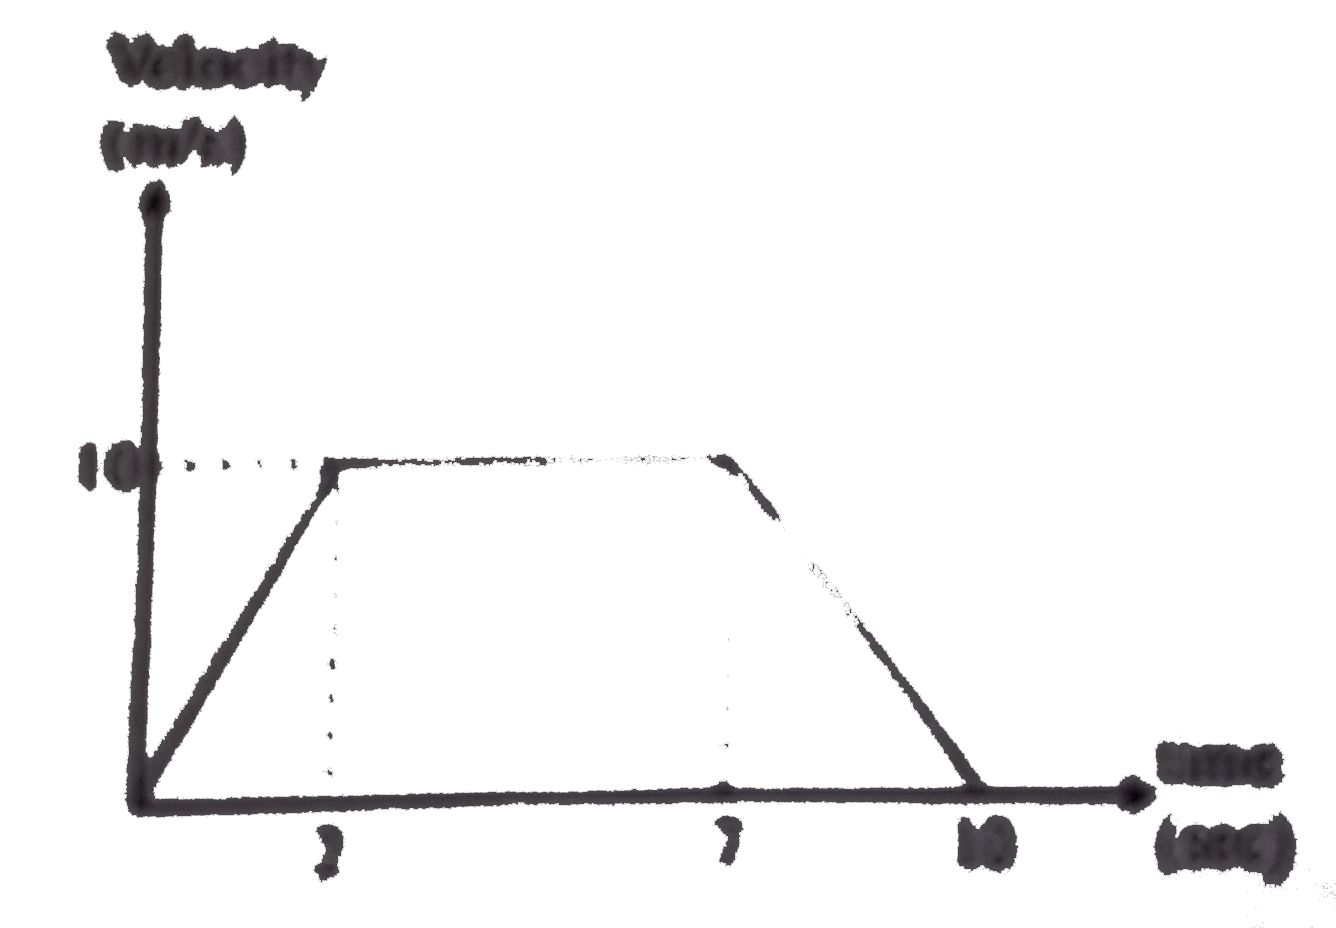
 The distance travelled by the car during the whole motion is:
A
B
C
D
Text Solution
Verified by Experts
The correct Answer is:


Topper's Solved these Questions
Similar Questions
Explore conceptually related problems
BANSAL-MASTER PRACTICE PROBLEM-Comphrehension
- The velocity- time graph of car moving on a straight track is given be...
Text Solution
|
- The velocity- time graph of car moving on a straight track is given be...
Text Solution
|
- The velocity- time graph of car moving on a straight track is given be...
Text Solution
|
- To find the speed of a river's current, boatman decides to carry out t...
Text Solution
|
- To find the speed of a river's current, boatman decides to carry out t...
Text Solution
|
- To find the speed of a river's current, boatman decides to carry out t...
Text Solution
|
- Friction is a force that aids us daily, in fact so much so that we don...
Text Solution
|
- Friction is a force that aids us daily, in fact so much so that we don...
Text Solution
|
- Friction is a force that aids us daily, in fact so much so that we don...
Text Solution
|
- A small block of mass m, can move without friction on the outside of a...
Text Solution
|
- A small block of mass m, can move without friction on the outside of a...
Text Solution
|
- A small block of mass m, can move without friction on the outside of a...
Text Solution
|
- A block of mass M slides on a frictionless surface with an initial spe...
Text Solution
|
- A block of mass M slides on a frictionless surface with an initial spe...
Text Solution
|
- A block of mass M slides on a frictionless surface with an initial spe...
Text Solution
|
- Two block of A and B of mass 1kg and 2kg are hung from light pulley. I...
Text Solution
|
- Two block of A and B of mass 1kg and 2kg are hung from light pulley. I...
Text Solution
|
- Two block of A and B of mass 1kg and 2kg are hung from light pulley. I...
Text Solution
|
- A particle of mass 1.5 kg moves along x-axis in a conservative force f...
Text Solution
|
- A particle of mass 1.5 kg moves along x-axis in a conservative force f...
Text Solution
|