A
B
C
D
Text Solution
Verified by Experts
The correct Answer is:


Topper's Solved these Questions
Similar Questions
Explore conceptually related problems
BANSAL-MASTER PRACTICE PROBLEM-Comphrehension
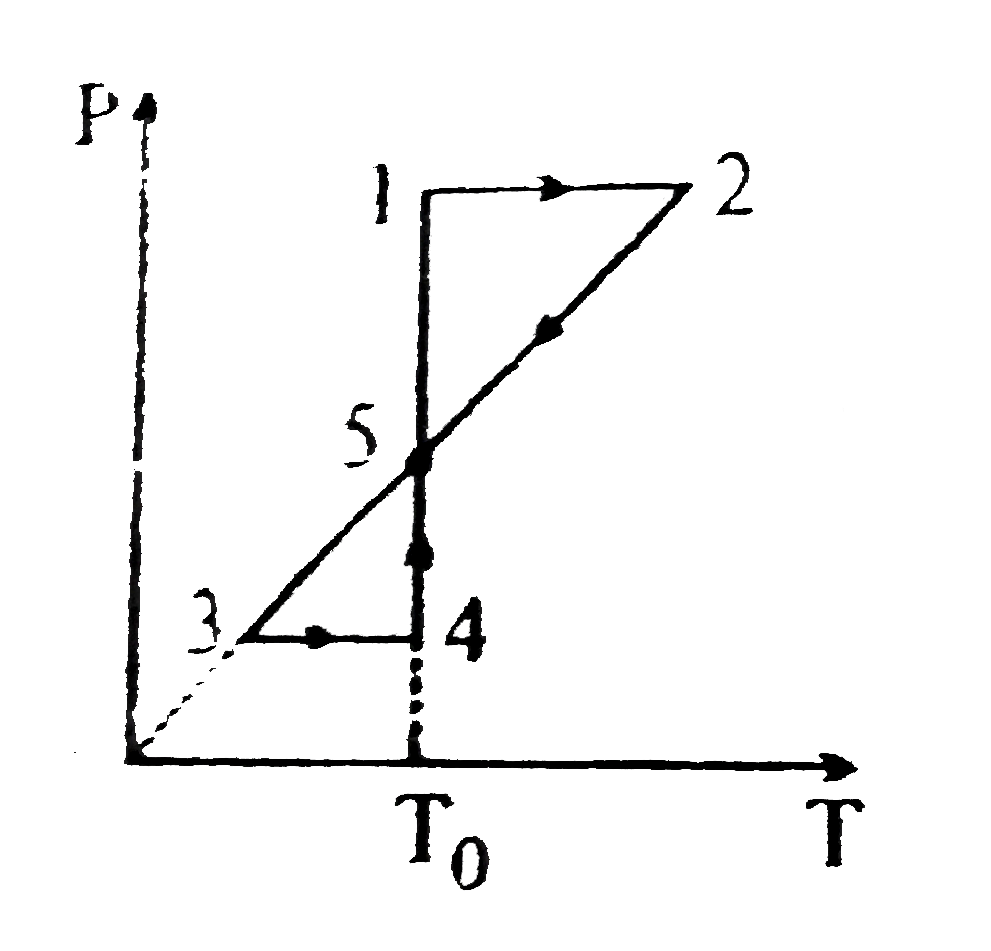
- Consider PT graph of cyclic process shown in the figure. Maximum press...
Text Solution
|
- Consider PT graph of cyclic process shown in the figure. Maximum press...
Text Solution
|
- Consider PT graph of cyclic process shown in the figure. Maximum press...
Text Solution
|
- Consider a gas at tmperature T occupying a volume V consisting of a mi...
Text Solution
|
- Consider a gas at temperature T occupying a volume V consisting of a m...
Text Solution
|
- In the cylinder shown in the figure, air is enclosed under the piston....
Text Solution
|
- In the cylinder shown in the figure, air is enclosed under the piston....
Text Solution
|
- Two cylinder A and B having piston conneted by massless rod (as shown ...
Text Solution
|
- Two cylinder A and B having piston conneted by massless rod (as shown ...
Text Solution
|
- Two cylinder A and B having piston conneted by massless rod (as shown ...
Text Solution
|
- Two cylinder A and B having piston conneted by massless rod (as shown ...
Text Solution
|
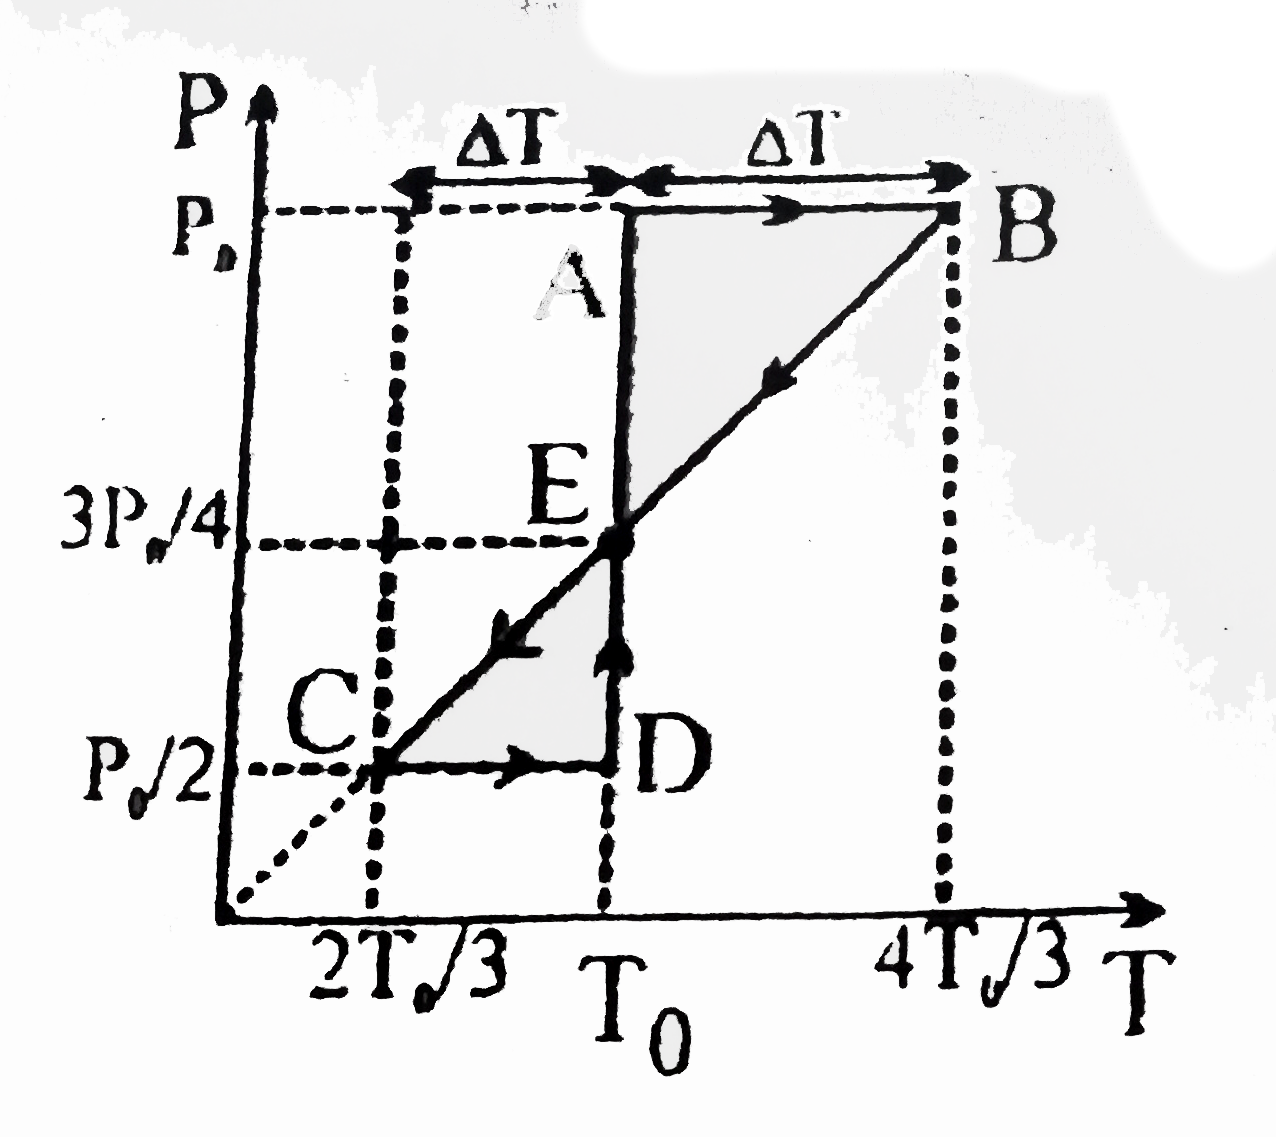
- The figure shows P - V diagram of a thermodynamic cycle The work ...
Text Solution
|
- The figure shows P - V diagram of a thermodynamic cycle If T(A),T...
Text Solution
|
- The figure shows P - V diagram of a thermodynamic cycle Identify ...
Text Solution
|
- The figure shows P - V diagram of a thermodynamic cycle Choose th...
Text Solution
|
- The figure shows P - V diagram of a thermodynamic cycle Choose th...
Text Solution
|
- There is a cubical cavity inside a conducting sphere of radius R. A po...
Text Solution
|
- There is a cubical cavity inside a conducting sphere of radius R. A po...
Text Solution
|
- There is a cubical cavity inside a conducting sphere of radius R. A po...
Text Solution
|
- Figure shows a schematic view of an electrostatic analyzer. It can sor...
Text Solution
|