A
B
C
D
Text Solution
Verified by Experts
The correct Answer is:


Topper's Solved these Questions
Similar Questions
Explore conceptually related problems
BANSAL-CENTRE OF MASS & MOMENTUM CONSERVATION-EXERCISE-4 (SECTION-B) (JEE-ADVANCED Previous Year Questions)
- A block of mass 0.50kg is moving with a speed of 2.00m//s on a smooth ...
Text Solution
|
- A thin rod of length 'L' is lying along the x-axis with its ends at x...
Text Solution
|
- Consider a rubber ball freely falling from a height h = 4.9 m onto a ...
Text Solution
|
- Statement -1: Two particles moving in the same direction do not lose a...
Text Solution
|
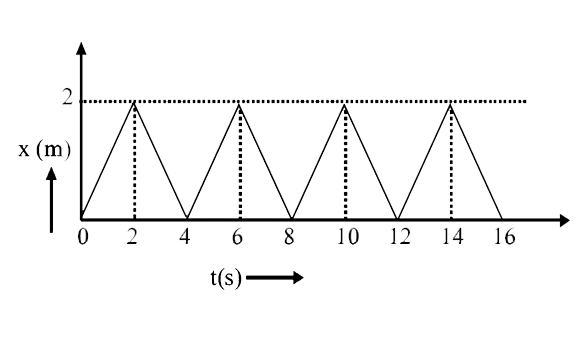
- The figure shows the position-time (x-t) graph of one-dimensional moti...
Text Solution
|
- This question has statement I and statement II. Of the four choices gi...
Text Solution
|
- Distance of the centre of mass of a solid uniform cone from its vertex...
Text Solution
|
- A particle of mass m moving in the x direction with speed 2v is hit by...
Text Solution
|