Home
Class 12
PHYSICS
The graph shows variation of v with chan...

The graph shows variation of `v` with change in `u` for a mirrorr. Points plotted above the point `P` on the curve are for values of `v`

A

smaller than f

B

smaller than 2f

C

larger than 2f

D

larger than f

Text Solution

Verified by Experts

The correct Answer is:
C
Promotional Banner

Topper's Solved these Questions

  • SEMICONDUCTORS

    BANSAL|Exercise Exercise-2|24 Videos
  • SEMICONDUCTORS

    BANSAL|Exercise Exercise-3|24 Videos
  • MASTER PRACTICE PROBLEM

    BANSAL|Exercise Additional topic|70 Videos
  • TEST PAPERS

    BANSAL|Exercise PHYSICS PART C|14 Videos

Similar Questions

Explore conceptually related problems

The graph in Fig. shows plot of variation of v with change in u for a concave mirror. Points plotted above the point P on the curve are for values of v : .

Plot a graph showing variation of current versus voltage for the material Ga.

Plot a graph showing variation of capacitive reactance with the change in the frequency of the AC source.

The graph showing correctly the variation of image distance (v) as a function of object distance (u) in case of a concave mirror is

The graph between u and v for a convex mirrorr is

As the position of an object (u) reflected from a concave mirrorr is varies, the position of the image (v) also varies. By letting the u changes from 0 to +oo the graph between v versus u will be

As the position of an object (u) reflected from a concave mirror is varied, the position of the image (v) also varies. By latting the u changes from 0 to + oo the graph between v versus u will be

Plot the point (4,3) on a graph sheet.Is it the same as the point (3,4)?

Let C be the curve y^(3) - 3xy + 2 =0 . If H is the set of points on the curve C, where the tangent is horizontal and V is the set of points on the curve C, where the tangent is vertical, then H = … and V = … .

BANSAL-SEMICONDUCTORS-CBSE Question
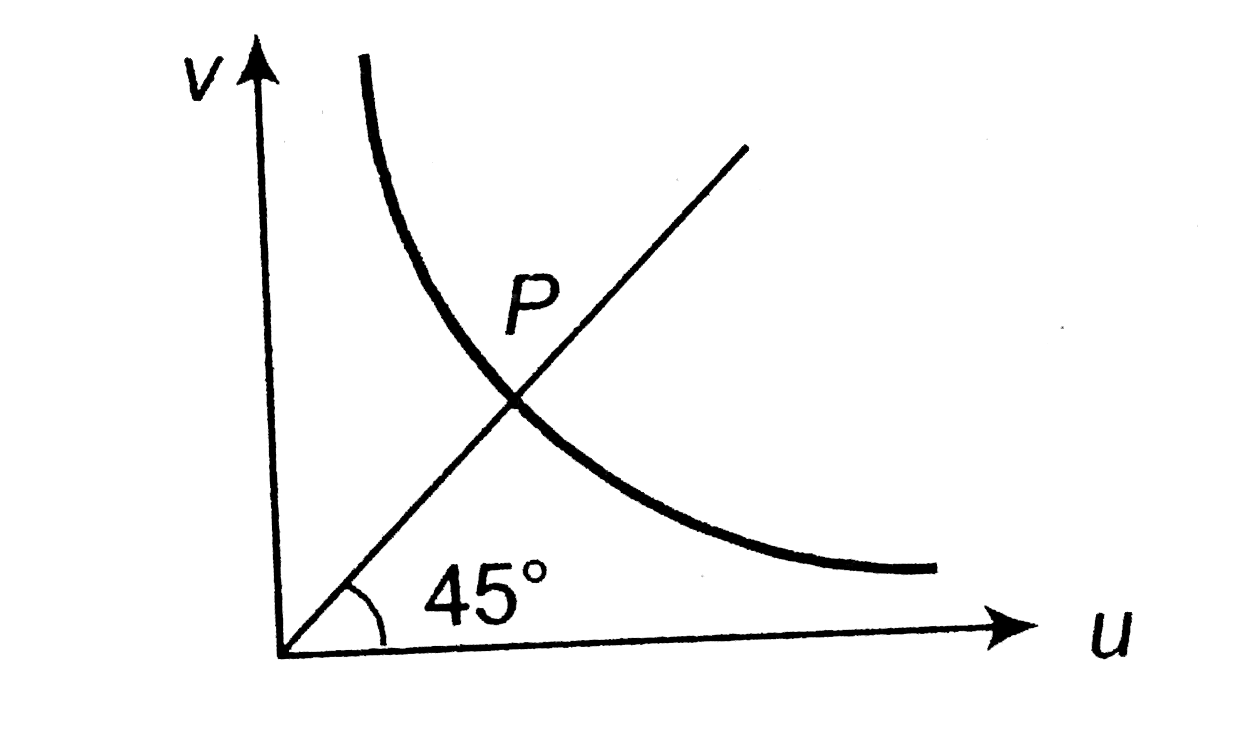
  1. The graph shows variation of v with change in u for a mirrorr. Points ...

    Text Solution

    |

  2. How does the width of the depletion layer of a p-n junction diode chan...

    Text Solution

    |

  3. In the following diagrams, write which of the nodes are forward biased...

    Text Solution

    |

  4. The output of a 2-inputs NAND gate is fed to a NOT gate. Write down th...

    Text Solution

    |

  5. ZENER DIODE AS VOLTAGE REGULATOR

    Text Solution

    |

  6. Draw a labelled circuit diagram for a common emitter amplifier using n...

    Text Solution

    |

  7. Name of gate obtained from the combination of gates shown in the figur...

    Text Solution

    |

  8. How is p-type semiconductor formed? Name the major charge carriers in ...

    Text Solution

    |

  9. ZENER DIODE AS VOLTAGE REGULATOR

    Text Solution

    |

  10. Draw a labelled circuit diagram of a common base amplifier using a p-n...

    Text Solution

    |

  11. Draw the voltage current characteristic fo a zener diode.

    Text Solution

    |

  12. With the help of a labelled circuit diagram, explain how an n-p-n tran...

    Text Solution

    |

  13. Give the logic symbol for an OR gate. Draw the output wave form for in...

    Text Solution

    |

  14. How does the resistivity of (i) a conductor and (ii) a semiconductor v...

    Text Solution

    |

  15. Distinguish between conductor (or metals), semiconductors and insulato...

    Text Solution

    |

  16. (a). Explains briefly with the help of a circuit diagram how V-I chara...

    Text Solution

    |

  17. Explain (i) forward biasing (ii) reverse biasing of a P-N junction dio...

    Text Solution

    |

  18. Distinguish between conductor (or metals), semiconductors and insulato...

    Text Solution

    |

  19. Two semiconductor materials X and Y shown in the given figure, are mad...

    Text Solution

    |

  20. Draw the circuit diagram of a common emitter amplifier using n-p-n tra...

    Text Solution

    |

  21. Expalin the formation of energy band in solids. Draw energy band diagr...

    Text Solution

    |