A
B
C
D
Text Solution
Verified by Experts
The correct Answer is:


Topper's Solved these Questions
MOTION IN ONE DIMENSION
ERRORLESS |Exercise Assertion & Reason|30 VideosMOTION IN ONE DIMENSION
ERRORLESS |Exercise Motion In One Dimension|24 VideosMOTION IN ONE DIMENSION
ERRORLESS |Exercise Critical Thinking|19 VideosGRAVITATION
ERRORLESS |Exercise SET|27 VideosMOTION IN TWO DIMENSION
ERRORLESS |Exercise Exercise|319 Videos
Similar Questions
Explore conceptually related problems
ERRORLESS -MOTION IN ONE DIMENSION-Graphical Questions
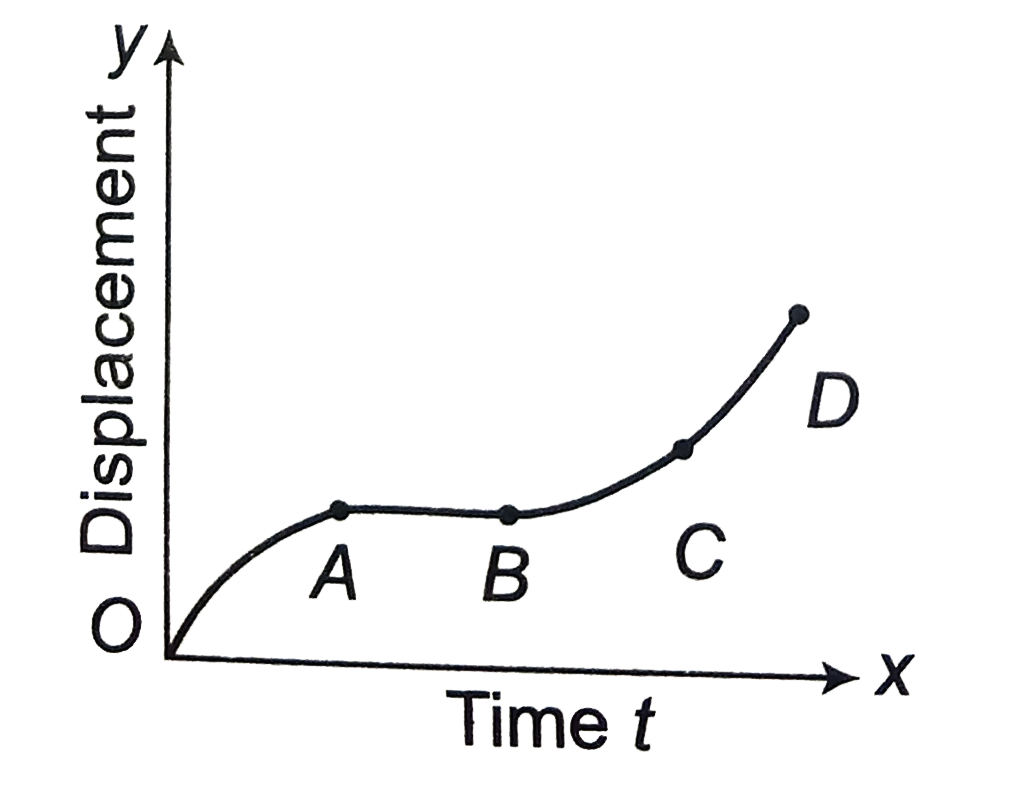
- The displacement of a particle as a function of time is shown in the f...
Text Solution
|
- A ball is thrown vertically upwards. Which of the following graph/grap...
Text Solution
|
- The graph between the displacement x and time t for a particle moving ...
Text Solution
|
- The v -t graph of a moving object is given in figure. The maximum acce...
Text Solution
|
- The displacement versus time graph for a body moving in a straight lin...
Text Solution
|
- The x -t graph shown in figure represents
Text Solution
|
- A lift is going up. The variation in the speed of the lift is as given...
Text Solution
|
- The velocity-time graph of a body moving in a straight line is shown i...
Text Solution
|
- Velocity-time graph for a moving object is shown in the figure. Total ...
Text Solution
|
- Figures (i) and (ii) below show the displacement-time graphs of two pa...
Text Solution
|
- For the velocity time graph shown in Fig. 2 (CF).14, the distance cove...
Text Solution
|
- In the following graph, distance travelled by the body in metres is
Text Solution
|
- Velocity-time curve for a body projected vertically upwards is
Text Solution
|
- The displacement-time graph of moving particle is shown below The...
Text Solution
|
- An object is moving with a uniform acceleration which is parallel to i...
Text Solution
|
- Which of the following graph represents uniform motion
Text Solution
|
- A ball is dropped vertically from a height d above the ground . It hit...
Text Solution
|
- The graph of displacement versus time is shown. Its corresponding velo...
Text Solution
|
- A train moves from one station to another in two hours time. Its speed...
Text Solution
|
- The area under acceleration-time graph gives
Text Solution
|