Home
Class 11
PHYSICS
The strain-stress curves of three wire o...

The strain-stress curves of three wire of different materials are shown in the figure. P,Q and R are the elastic limits of the wires. The figures shows that

A

Elasticity of wire P is maximum

B

Elastiity of wire Q is maximum

C

Tensile strength of R is maximum

D

None of the above is true

Text Solution

Verified by Experts

The correct Answer is:
D
Promotional Banner

Topper's Solved these Questions

  • ELASTICITY

    ERRORLESS |Exercise Assertion and Reason|12 Videos
  • ELASTICITY

    ERRORLESS |Exercise Self Evaluation Test|11 Videos
  • ELASTICITY

    ERRORLESS |Exercise Critical Thinking|8 Videos
  • FLUID MECHANICS

    ERRORLESS |Exercise Fluid Mechanics|19 Videos

Similar Questions

Explore conceptually related problems

The strain-stress curves of three wires of different materials ar shown in the figure P,Q and R are the elastic limits of the wires. The figure shows that :

The strain stress curves of three wires of different materials are shown in the figure. P, Q and R are the elastic limits of the wires. The figure shown that

The stain-stress curves of three wires of different material are showm in the figure P,Q,R are the elastic limits of the wires, the figure shows that

The stress versus strain graphs for wires of two materials A and B are as shown in the figure. If YA and YB are the Young's moduli of the materials then

The stress strain curves for brass, steel and rubber are shown in the figure. The lines A, B and C are for

The stress versus strain graphs for wires of two materials A and B are as shown in the figure. If Y_(A) and Y_(B) are the younng's moduli of the materials, then

Shown in the figure . Find out the current in the wire BD

A wire is sliding as shown in Figure. The angle between the acceleration and the velocity of the wire is

Stress - strain graph of three different are as shown. A,B and C are the Young's modulus of the wires. Which of the following statement is correct ?

ERRORLESS -ELASTICITY-Graphical Question
  1. The graph shown was obtained from experimental measurements of the per...

    Text Solution

    |

  2. A graph is shown between stress and strain for a metal. The part in wh...

    Text Solution

    |

  3. In the above graph, point B indicates.

    Text Solution

    |

  4. In the graph, point D indicates

    Text Solution

    |

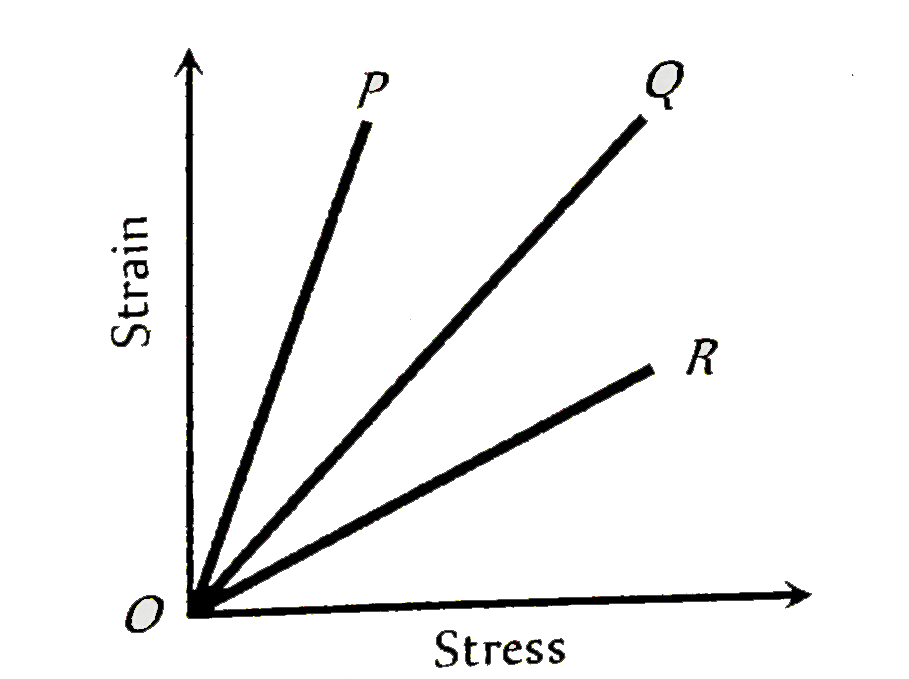
  5. The strain-stress curves of three wire of different materials are show...

    Text Solution

    |

  6. The diagram shows a force extension graph for a rubber band, consider ...

    Text Solution

    |

  7. The stress versus strain graphs for wires of two materials A and B are...

    Text Solution

    |

  8. The load versus elongation graph for four wires of the same material i...

    Text Solution

    |

  9. The adjacent graph shows the estension (Deltal) of a wire of length 1m...

    Text Solution

    |

  10. The diagram represents the applied force per unit area (F) with the...

    Text Solution

    |

  11. The graph shows the behaviout of a length of wire in the region for wh...

    Text Solution

    |

  12. The potential energy U between two molecules as a function of the dist...

    Text Solution

    |

  13. The valve of force constant between the applied the applied elastic fo...

    Text Solution

    |

  14. The diagram shows stress v/s strain curve for the materials A and B. F...

    Text Solution

    |

  15. Which one of the following is the Young's modulus (in N/m) for the wir...

    Text Solution

    |

  16. The diagram shows the change x in the length of the uniform wire cause...

    Text Solution

    |

  17. A student plots a graph from his reading on the determination of Young...

    Text Solution

    |

  18. the points of maximum and minimum attraction in the curve between pote...

    Text Solution

    |

  19. The stress strain curves for brass, steel and rubber are shown in the ...

    Text Solution

    |