A
B
C

D
Text Solution
Verified by Experts
The correct Answer is:


Topper's Solved these Questions
THERMOMETRY, THERMAL EXPANSION AND CALORIMETRY
ERRORLESS |Exercise Assertion & Reason|14 VideosTHERMOMETRY, THERMAL EXPANSION AND CALORIMETRY
ERRORLESS |Exercise Self Evaluation Test|15 VideosTHERMOMETRY, THERMAL EXPANSION AND CALORIMETRY
ERRORLESS |Exercise Critical Thinking|27 VideosTHERMODYNAMICS
ERRORLESS |Exercise All Questions|304 VideosTRANSMISSION OF HEAT
ERRORLESS |Exercise ET Self Evaluation Test|23 Videos
Similar Questions
Explore conceptually related problems
ERRORLESS -THERMOMETRY, THERMAL EXPANSION AND CALORIMETRY -Graphical Questions
- The graph AB shown in figure is a plot of temperature of a body in deg...
Text Solution
|
- The graph shows the variation of temperature (T) of one kilogram of a ...
Text Solution
|
- A block of ice at -10^@C is slowly heated and converted to steam at 10...
Text Solution
|
- The portion AB of the indicator diagram representing the state of matt...
Text Solution
|
- The figure given below shows the cooling curve of pure wax material af...
Text Solution
|
- A solid substance is at 30^(@)C . To this substance heat energy is sup...
Text Solution
|
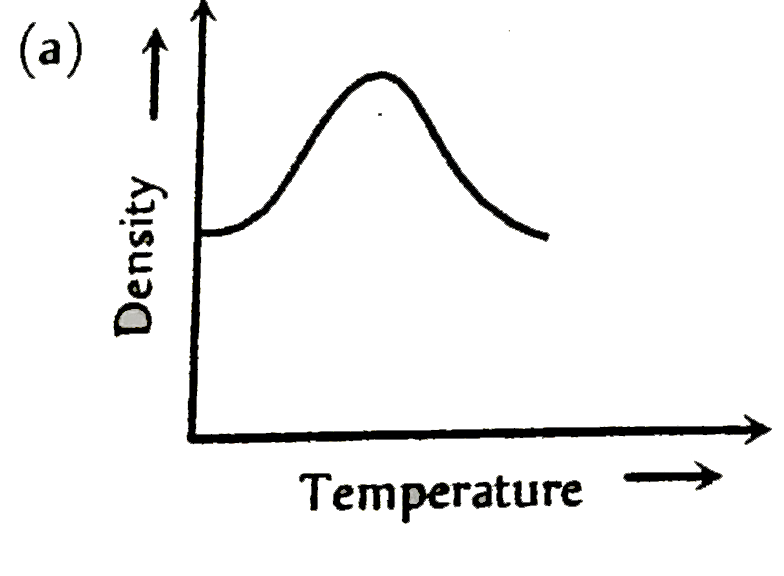
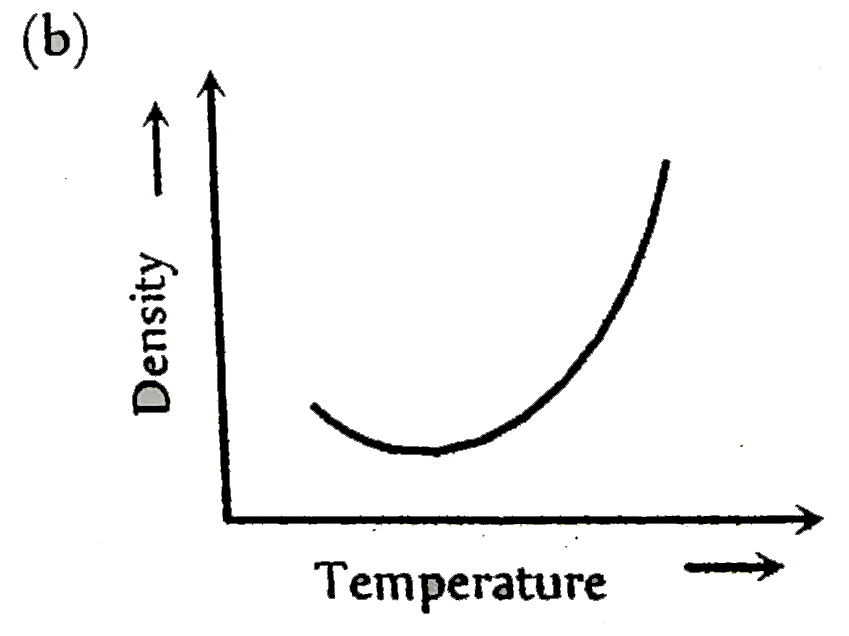
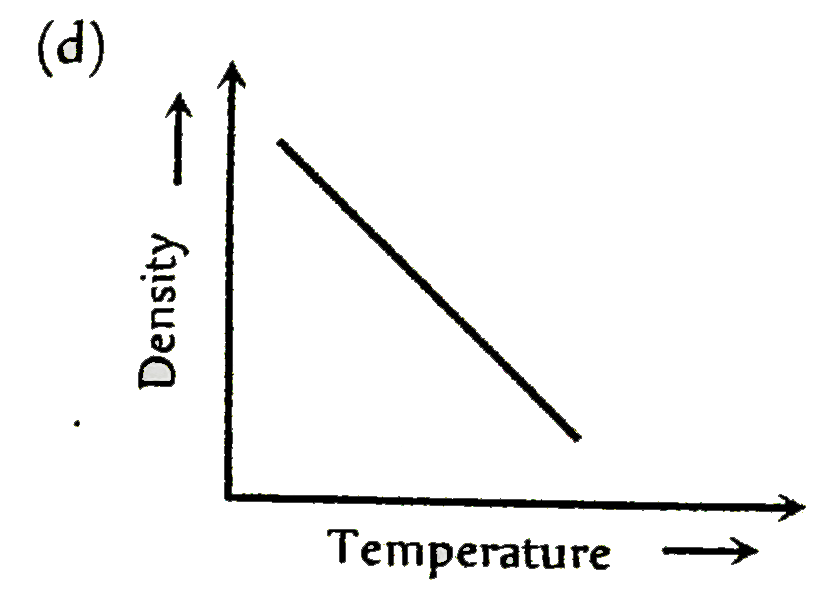
- Which of the following curve represent variation of density of water w...
Text Solution
|
- If a graph is plotted taking the temperature in Fahrenheit along the Y...
Text Solution
|
- Which of the curves in figure represents the telation between Celsius ...
Text Solution
|
- Heat is supplied to a certain homogeneous sample of matter, at a unifo...
Text Solution
|
- A student takes 50 g wax (specific heat =0.6 kcal//kg^(@)C) and heats ...
Text Solution
|
- The graph signifies
Text Solution
|
- Which of the substances A, B or C has the highest specific heat ? The ...
Text Solution
|
- Two substances A and B of equal mass m are heated at uniform rate of 6...
Text Solution
|