


Similar Questions
Explore conceptually related problems
Recommended Questions
- The variation in the speed of a car during its two hour journey is sho...
Text Solution
|
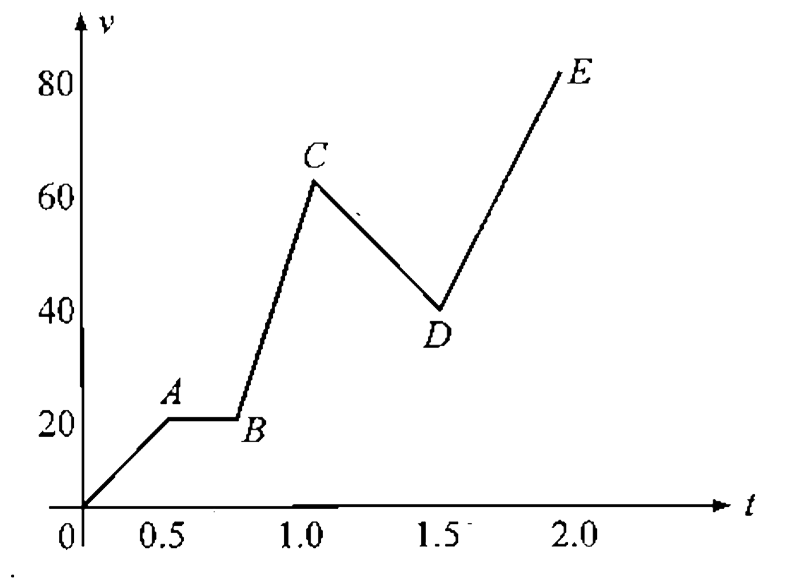
- The speed of a car as a function of time is shown in figure. Fin...
Text Solution
|
- The graph below represents the velocity vs. time graph for a car. ...
Text Solution
|
- A train moves from one station to another in two hours time. Its speed...
Text Solution
|
- The variation in the speed of a car during its two hour journey is sho...
Text Solution
|
- चित्र 3.40 में सीधी रेखा में गतिशील कार स्थिति - समय ग्राफ प्रदर्शित ह...
Text Solution
|
- चित्र 3.40 में सीधी रेखा में गतिशील कार स्थिति - समय ग्राफ प्रदर्शित ह...
Text Solution
|
- A car covers half of its journey with a speed of 10ms^(-1) and the oth...
Text Solution
|
- The speed of a car as a function of time is shown in figure. Fin...
Text Solution
|