


Similar Questions
Explore conceptually related problems
Recommended Questions
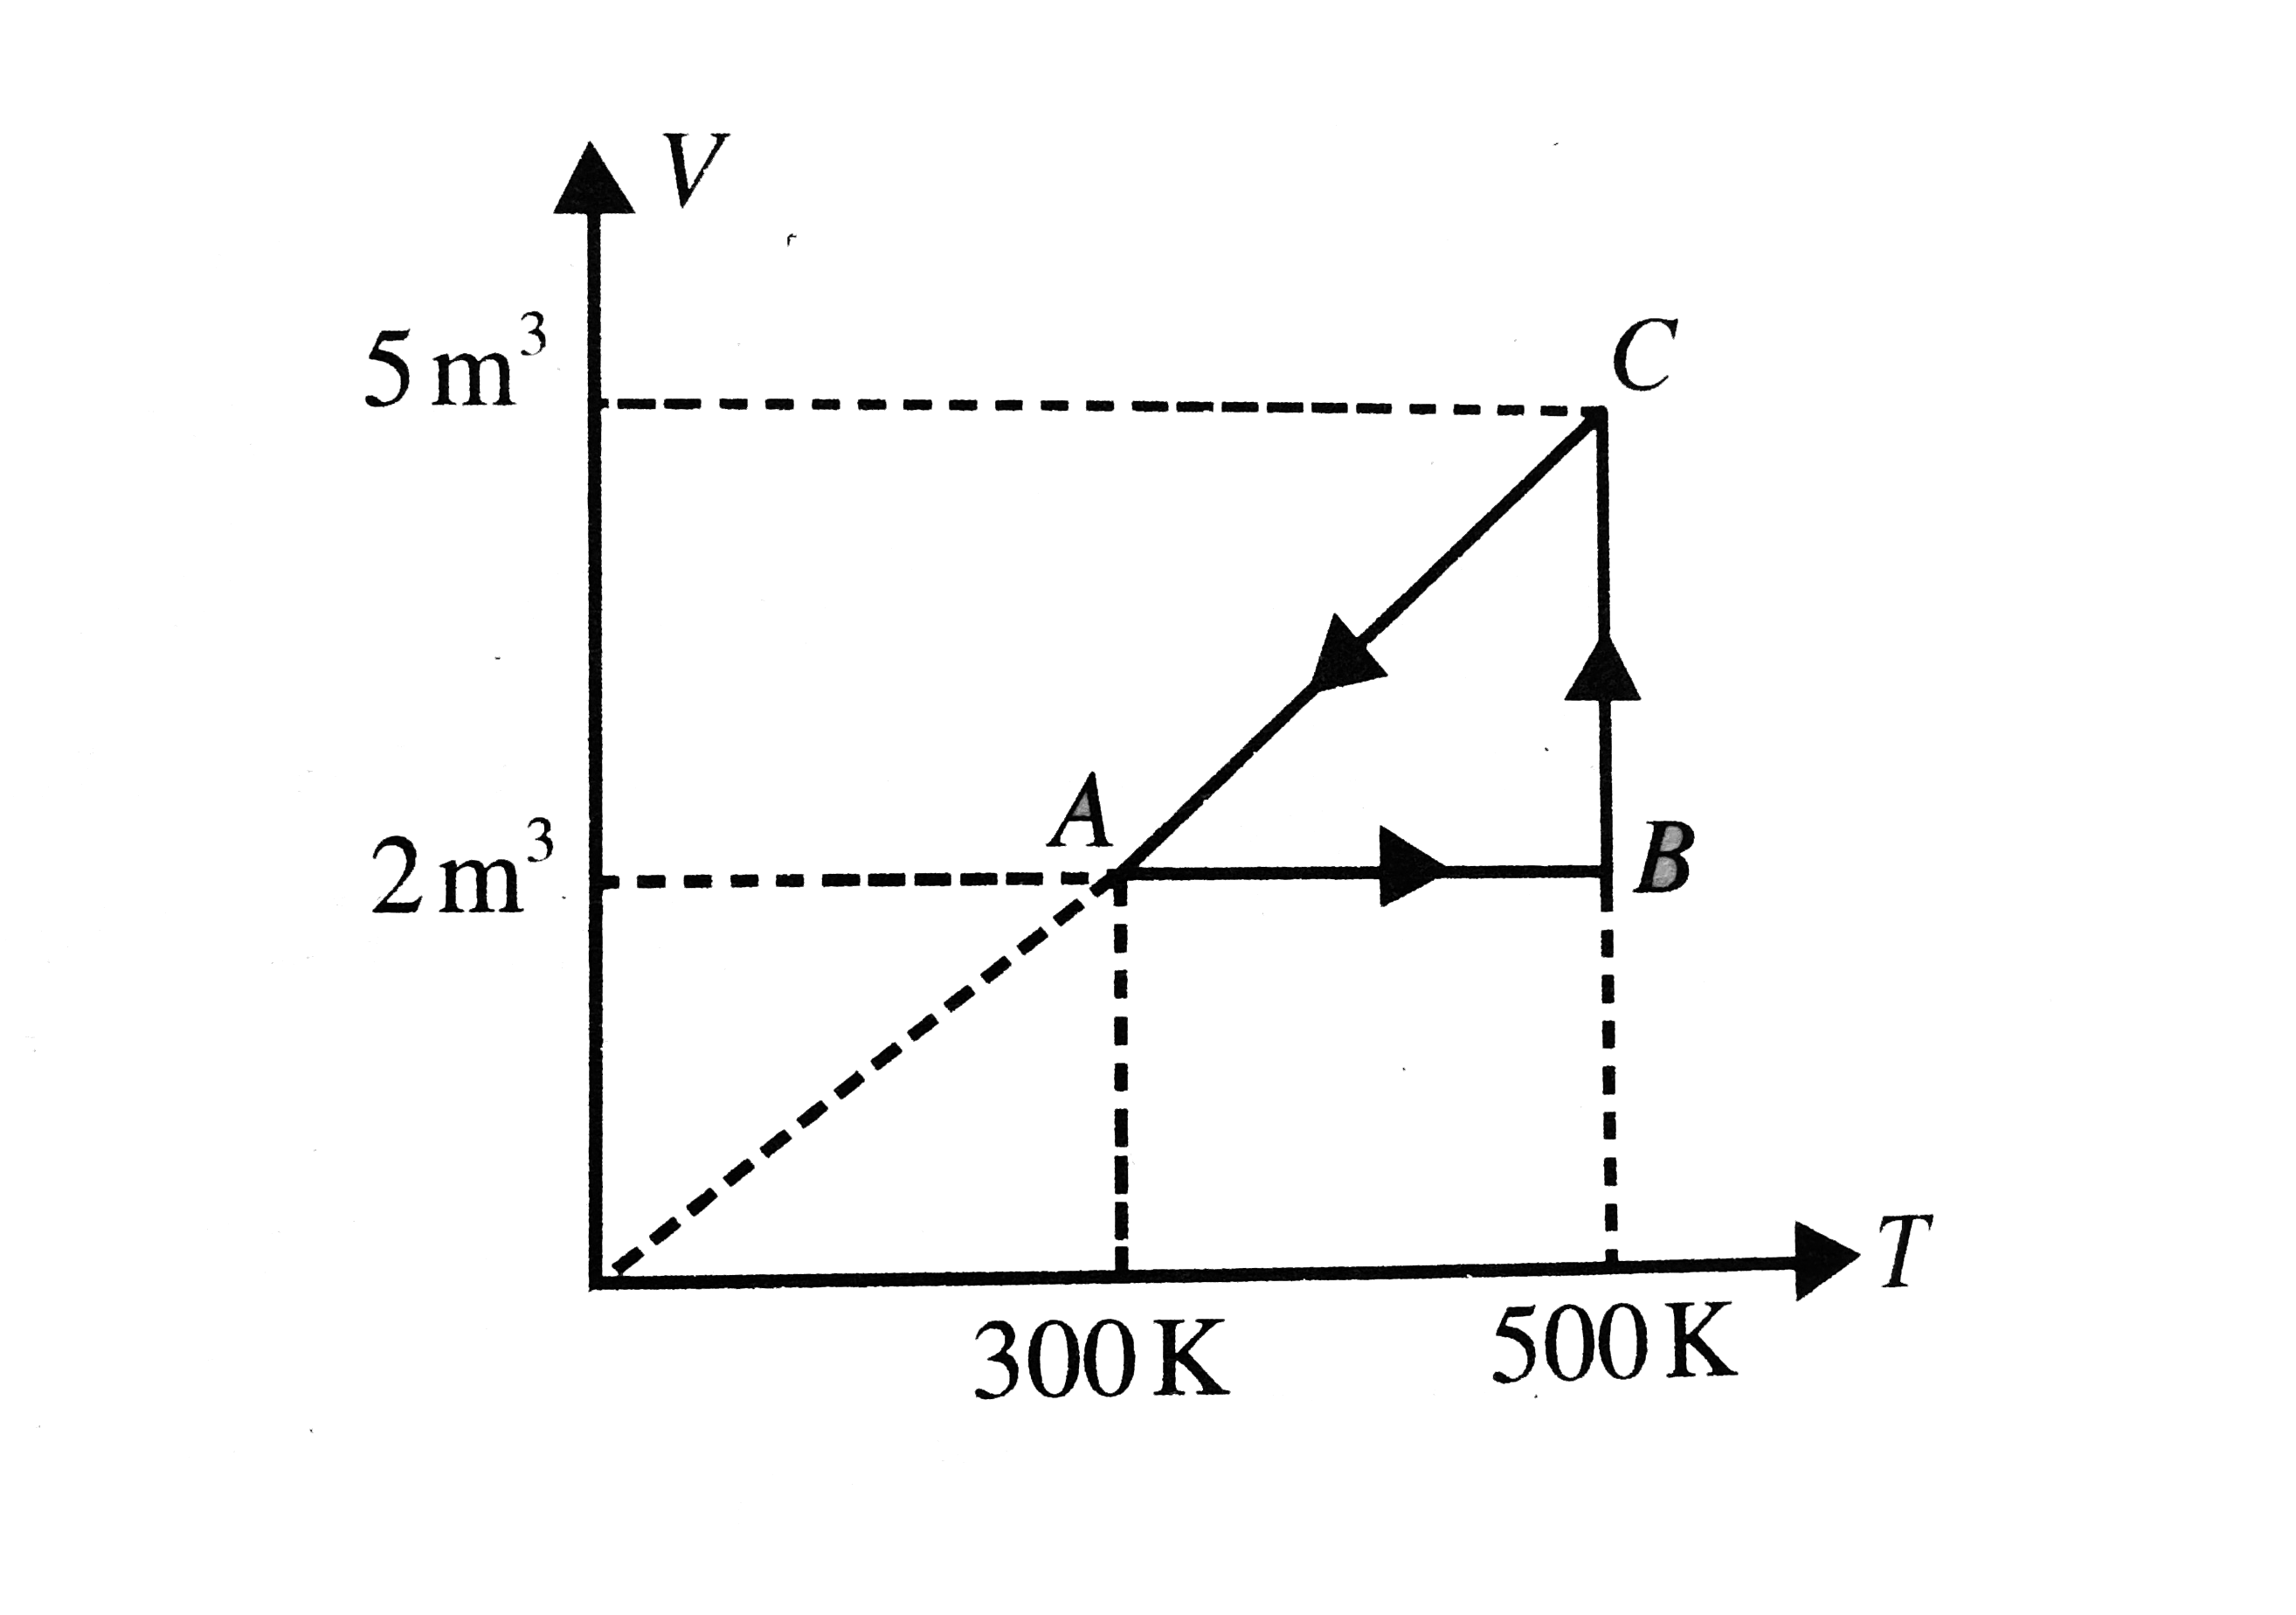
- Fig. shows a process ABCA performed on 1 mole of an ideal gas. Find th...
Text Solution
|
- Shows a process ABCA performed on an ideal gas. Find the net heat give...
Text Solution
|
- Consider the cyclic process ABCA, shown in, performed on a sample of ...
Text Solution
|
- Fig. shows a process ABCA performed on 1 mole of an ideal gas. Find th...
Text Solution
|
- In the following cyclic process abca, find the net heat given to the s...
Text Solution
|
- Consider the cyclic process abca performed on a sample of 2.0 mole of ...
Text Solution
|
- One mole of an ideal monoatomic gas is taken through the thermodynamic...
Text Solution
|
- Two moles of an ideal monoatomic gas undergoes a cyclic process ABCA a...
Text Solution
|
- Figure Shows a process ABCA performed on an ideal gas. Find the net he...
Text Solution
|