


Similar Questions
Explore conceptually related problems
Recommended Questions
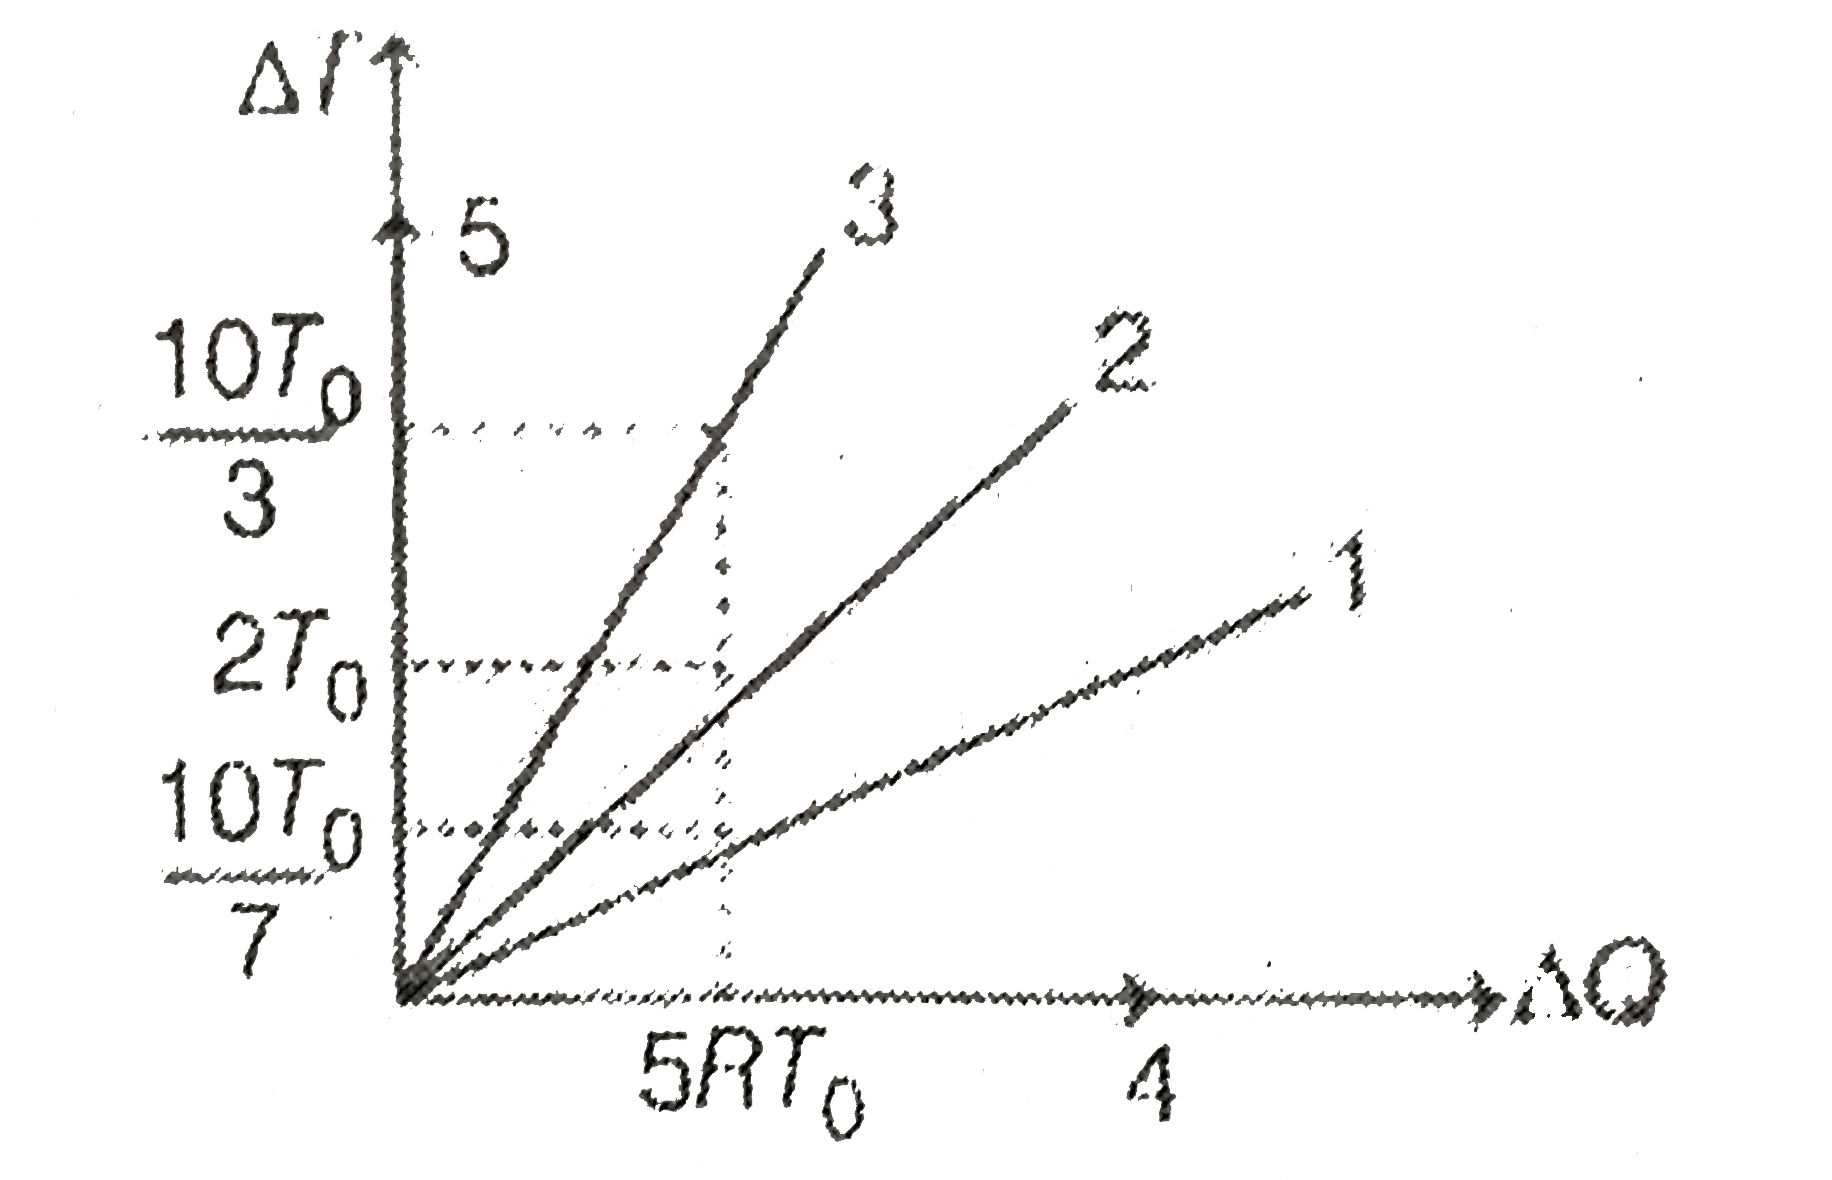
- Figure (Five straight line numbered 1, 2, 3, 4 and 5) shows graph of c...
Text Solution
|
- A reversible heat engine carries 1 mole of an ideal monatomic gas arou...
Text Solution
|
- V-T graph of a process of monoatomic ideal gas is shown in figure. Hea...
Text Solution
|
- A gas of adiabatic exponent gamma is supplied heat at a constant press...
Text Solution
|
- Figure (Five straight line numbered 1, 2, 3, 4 and 5) shows graph of c...
Text Solution
|
- The straight lines in the figure depict the variations in temperature ...
Text Solution
|
- When heat Q is supplied to a diatomic gas of rigid molecules, at const...
Text Solution
|
- An ideal gas undergoes the process 1 to 2 as shown in the figure, the ...
Text Solution
|
- The figure shows a velocity-time graph of a particle moving along a st...
Text Solution
|