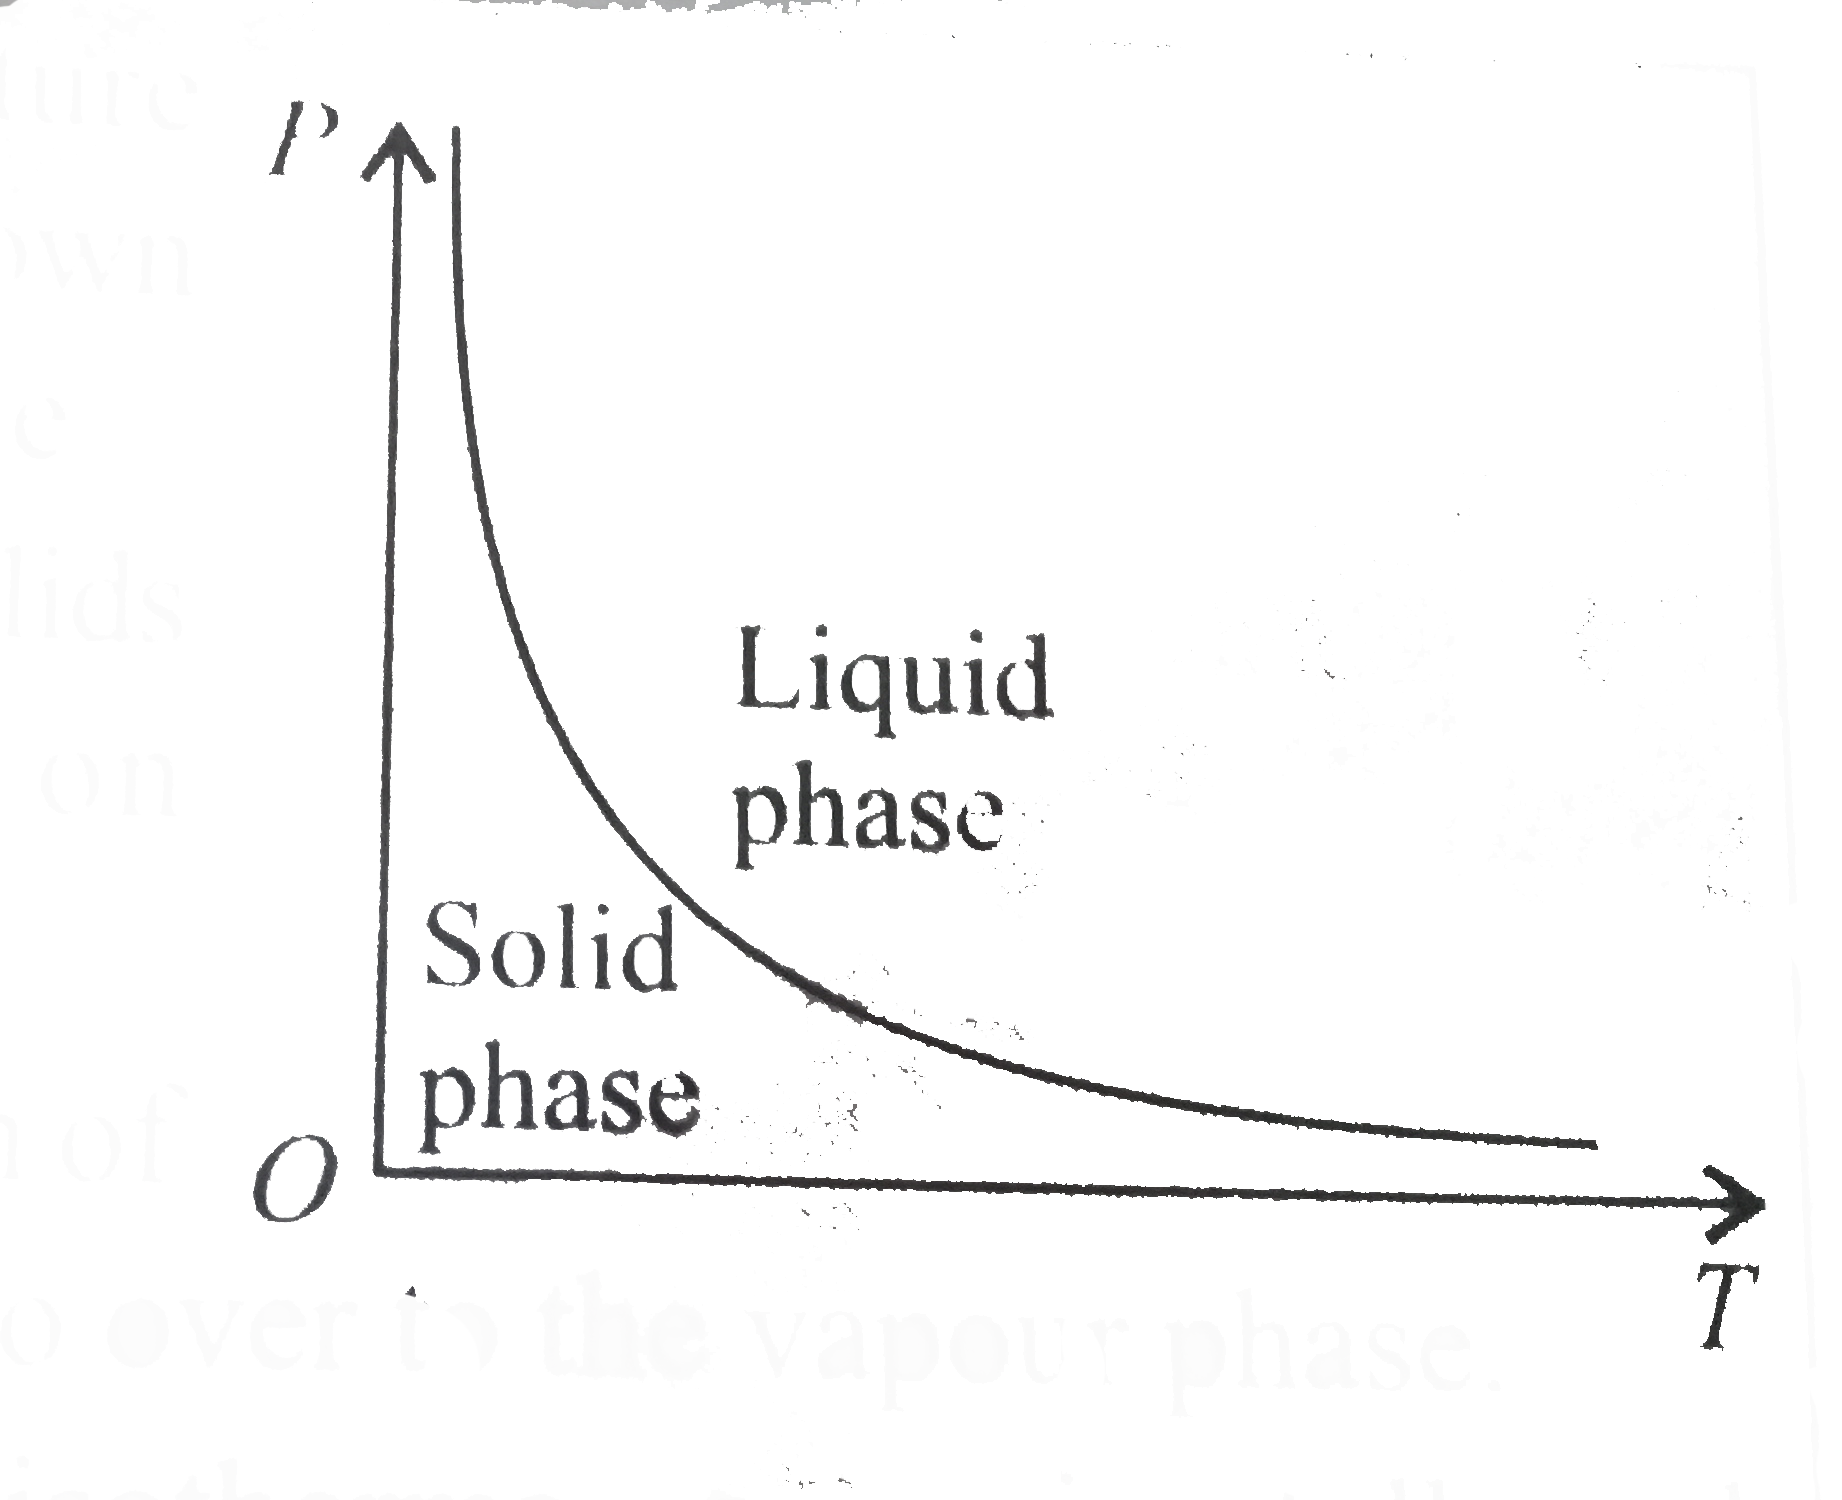
The pressure -temperature `(P-T)` phase diagram shown below corresponds to the
a. Curve of fusion of solids that expand on solidification.
b. Curve of sublimation of solides that directly go over to the vapour phase.
The pressure -temperature `(P-T)` phase diagram shown below corresponds to the
a. Curve of fusion of solids that expand on solidification.
b. Curve of sublimation of solides that directly go over to the vapour phase.
a. Curve of fusion of solids that expand on solidification.
b. Curve of sublimation of solides that directly go over to the vapour phase.


Similar Questions
Explore conceptually related problems
Assertion : In pressure-temperature (P-T) phase diagram of water, the slope of the melting curve is found to be negative. Reason : Ice contracts on melting to water.
P-T diagram is shown below then choose the corresponding V-T diagram
Assertion : In pressure-temperature ( P - T ) phase diagram of water, the slope of the melting curve is found to be negative. Reason : Ice contracts on melting to water
According to the phase diagram shown, where does a mixture of solid and liquid exist at equilibrium ?
Each phase of a material can exits only in certain regions of pressure and temperature . P-T phase diagrams, in which pressure is plotted versus temperature, show the regions corresponding to various phases and phase transformations . P-V diagrams, on the other hand , can be used to study pressure volume relationship at a constant temperature. If the liquid and gaseous phases of a pure substances are heated together in a closed container, both the temperature and the vapor pressure will increase until a point is reached at which the two phases can no longer be distinguished from one another. The temperature and pressure at which this occurs are called the critical temperature and pressure. Exceeding either of these parameters, by itself ,will cause the "gas"//"liguid" phase transition to disappear. if the other variable is then changed as well, while the first variable is maintained above its critical point , a gradual transition will occur between the gaseous and liquid phases, with no clear boundary.(The liquid and solid phases, on the other hand , maintain a distinct boundary at all pressure above the triple point). Shown in figure is a combined P-T phase diagram for material A and B . If heat is added to solids A and B , each in a container that is open to the atmosphere :-
Each phase of a material can exits only in certain regions of pressure and temperature . P-T phase diagrams, in which pressure is plotted versus temperature, show the regions corresponding to various phases and phase transformations . P-V diagrams, on the other hand , can be used to study pressure volume relationship at a constant temperature. If the liquid and gaseous phases of a pure substances are heated together in a closed container, both the temperature and the vapor pressure will increase until a point is reached at which the two phases can no longer be distinguished from one another. The temperature and pressure at which this occurs are called the critical temperature and pressure. Exceeding either of these parameters, by itself ,will cause the "gas"//"liguid" phase transition to disappear. if the other variable is then changed as well, while the first variable is maintained above its critical point , a gradual transition will occur between the gaseous and liquid phases, with no clear boundary.(The liquid and solid phases, on the other hand , maintain a distinct boundary at all pressure above the triple point). Shown in figure is a combined P-T phase diagram for material A and B . If heat is added to solids A and B , each in a container that is open to the atmosphere :-
Each phase of a material can exits only in certain regions of pressure and temperature . P-T phase diagrams, in which pressure is plotted versus temperature, show the regions corresponding to various phases and phase transformations . P-V diagrams, on the other hand , can be used to study pressure volume relationship at a constant temperature. If the liquid and gaseous phases of a pure substances are heated together in a closed container, both the temperature and the vapor pressure will increase until a point is reached at which the two phases can no longer be distinguished from one another. The temperature and pressure at which this occurs are called the critical temperature and pressure. Exceeding either of these parameters, by itself ,will cause the "gas"//"liguid" phase transition to disappear. if the other variable is then changed as well, while the first variable is maintained above its critical point , a gradual transition will occur between the gaseous and liquid phases, with no clear boundary.(The liquid and solid phases, on the other hand , maintain a distinct boundary at all pressure above the triple point). Shown in figure is a combined P-T phase diagram for material A and B . If heat is added to solids A and B , each in a container that is open to the atmosphere :-
Each phase of a material can exits only in certain regions of pressure and temperature . P-T phase diagrams, in which pressure is plotted versus temperature, show the regions corresponding to various phases and phase transformations . P-V diagrams, on the other hand , can be used to study pressure volume relationship at a constant temperature. If the liquid and gaseous phases of a pure substances are heated together in a closed container, both the temperature and the vapor pressure will increase until a point is reached at which the two phases can no longer be distinguished from one another. The temperature and pressure at which this occurs are called the critical temperature and pressure. Exceeding either of these parameters, by itself ,will cause the "gas"//"liguid" phase transition to disappear. if the other variable is then changed as well, while the first variable is maintained above its critical point , a gradual transition will occur between the gaseous and liquid phases, with no clear boundary.(The liquid and solid phases, on the other hand , maintain a distinct boundary at all pressure above the triple point). Shown in figure is a combined P-T phase diagram for material A and B . Which is true about the substance in figure?
Each phase of a material can exits only in certain regions of pressure and temperature . P-T phase diagrams, in which pressure is plotted versus temperature, show the regions corresponding to various phases and phase transformations . P-V diagrams, on the other hand , can be used to study pressure volume relationship at a constant temperature. If the liquid and gaseous phases of a pure substances are heated together in a closed container, both the temperature and the vapor pressure will increase until a point is reached at which the two phases can no longer be distinguished from one another. The temperature and pressure at which this occurs are called the critical temperature and pressure. Exceeding either of these parameters, by itself ,will cause the "gas"//"liguid" phase transition to disappear. if the other variable is then changed as well, while the first variable is maintained above its critical point , a gradual transition will occur between the gaseous and liquid phases, with no clear boundary.(The liquid and solid phases, on the other hand , maintain a distinct boundary at all pressure above the triple point). Shown in figure is a combined P-T phase diagram for material A and B . Which is true about the substance in figure?
Each phase of a material can exits only in certain regions of pressure and temperature . P-T phase diagrams, in which pressure is plotted versus temperature, show the regions corresponding to various phases and phase transformations . P-V diagrams, on the other hand , can be used to study pressure volume relationship at a constant temperature. If the liquid and gaseous phases of a pure substances are heated together in a closed container, both the temperature and the vapor pressure will increase until a point is reached at which the two phases can no longer be distinguished from one another. The temperature and pressure at which this occurs are called the critical temperature and pressure. Exceeding either of these parameters, by itself ,will cause the "gas"//"liguid" phase transition to disappear. if the other variable is then changed as well, while the first variable is maintained above its critical point , a gradual transition will occur between the gaseous and liquid phases, with no clear boundary.(The liquid and solid phases, on the other hand , maintain a distinct boundary at all pressure above the triple point). Shown in figure is a combined P-T phase diagram for material A and B . Which is true about the substance in figure?
Recommended Questions
- The pressure -temperature (P-T) phase diagram shown below corresponds ...
Text Solution
|
- The pressure -temperature (P-T) phase diagram shown below corresponds ...
Text Solution
|
- Answer the following question beased on tbhe P-T phase diagram of carb...
Text Solution
|
- Carbon dioxide unusual because it has no liquid phase at normal atmosp...
Text Solution
|
- (a) Conversion of solid of vapour is called sublimation . Name the ter...
Text Solution
|
- Assertion : In pressure-temperature (P-T) phase diagram of water, the ...
Text Solution
|
- Assertion : In pressure-temperature ( P - T ) phase diagram of water,...
Text Solution
|
- The pressure at equilibrium over solid A is 50 atm and over solid D is...
Text Solution
|
- Answer the following questions based on the P-T phase diagram of carbo...
Text Solution
|