A
B
C
D
Text Solution
Verified by Experts
The correct Answer is:


Topper's Solved these Questions
NEWTONS LAWS OF MOTION
ERRORLESS |Exercise Assertion & Reason|25 VideosNEWTONS LAWS OF MOTION
ERRORLESS |Exercise Self Evaluation Test|16 VideosNEWTONS LAWS OF MOTION
ERRORLESS |Exercise Critical Thinking|19 VideosMOTION IN TWO DIMENSION
ERRORLESS |Exercise Exercise|319 VideosROTATIONAL MOTION
ERRORLESS |Exercise Practice Problems (Problems based on motion of connected mass)|10 Videos
Similar Questions
Explore conceptually related problems
ERRORLESS -NEWTONS LAWS OF MOTION-Graphical Questions
- A block B is placed on the block A.The mass of block B is less than th...
Text Solution
|
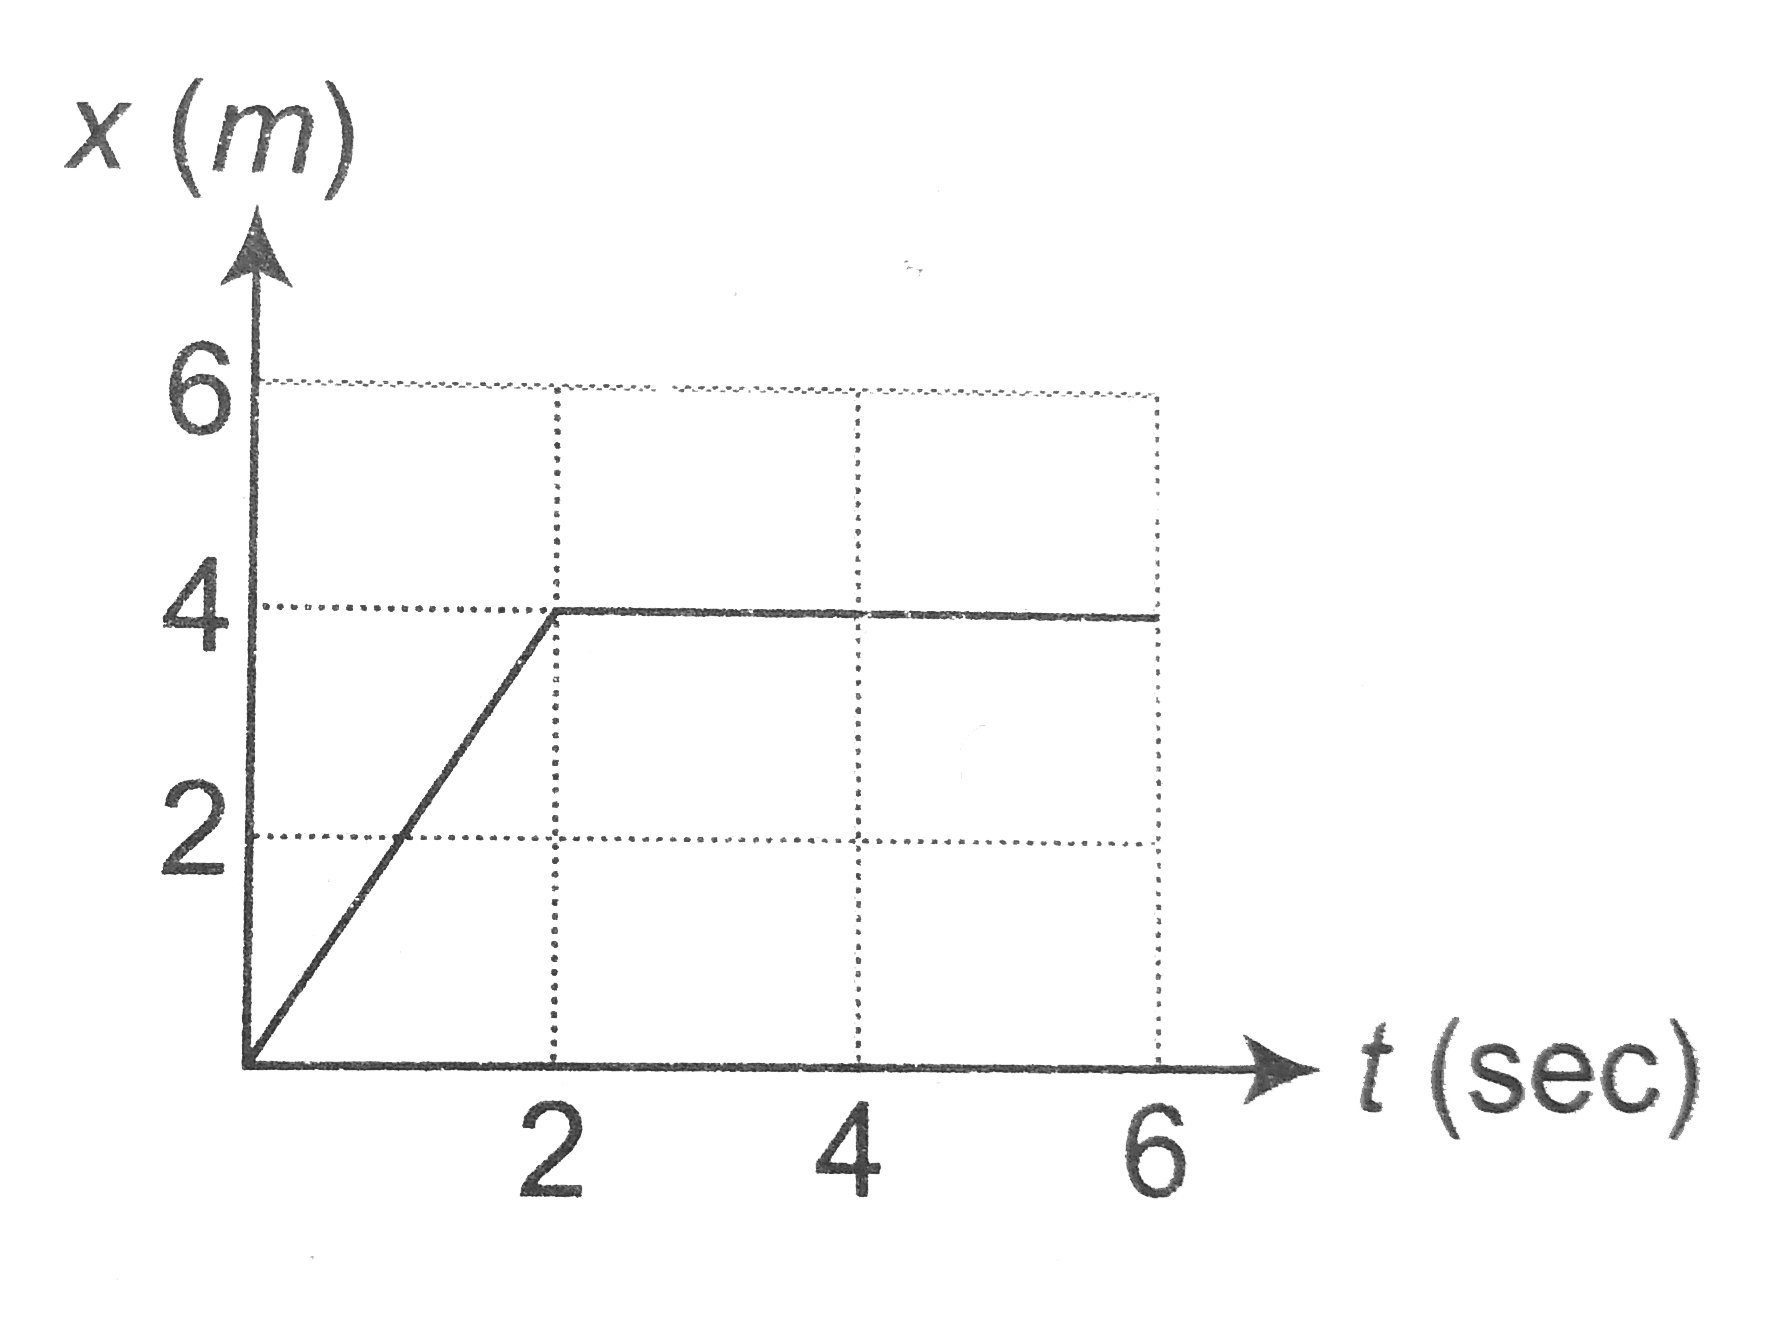
- In the figure given below, the position-time graph of a particle of ma...
Text Solution
|
- The force-time( F – t ) curve of a particle executing linear motion is...
Text Solution
|
- Figure shows the displacement of a particle going along the X-axis as ...
Text Solution
|
- A body of 2kg has an initial speed 5ms^(-1) . A force acts on it for s...
Text Solution
|
- Which of the following graph depicts spring constant k versus length l...
Text Solution
|
- A particle of mass m moving with velocity u makes an elastic one-dimen...
Text Solution
|
- A particle of mass m , initially at rest , is acted upon by a variable...
Text Solution
|
- A body of mass 3 kg is acted on by a force which varies as shown in th...
Text Solution
|
- The variation of momentum with time of one of the body in a two body c...
Text Solution
|
- Figures I, II, III, and IV depict variation of force with time The imp...
Text Solution
|