A
B
C
D
Text Solution
Verified by Experts
The correct Answer is:


Topper's Solved these Questions
Similar Questions
Explore conceptually related problems
ERRORLESS -GRAVITATION-GQ
- Assuming the earth to have a constant density, point out which of the ...
Text Solution
|
- The diagram showing the variation of gravitational potential of earth ...
Text Solution
|
- By which curve will the variation of gravitational potential of a holl...
Text Solution
|
- A cavity of radius R//2 is made inside a solid sphere of radius R. The...
Text Solution
|
- Which one of the following plots represents the variation of the gravi...
Text Solution
|
- Suppose the acceleration due to gravity at earth's surface is 10ms^-2 ...
Text Solution
|
- Which of the following graphs represents the motion of the planet movi...
Text Solution
|
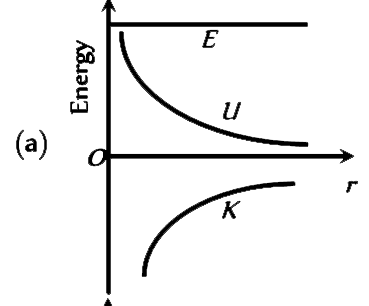
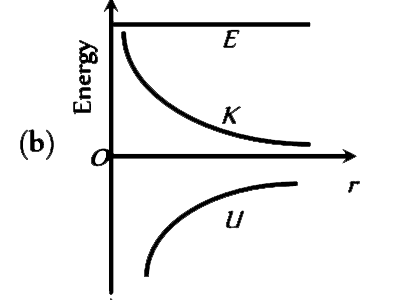
- The curves for potential energy ( U ) and kinetic energy (E(k)) of a t...
Text Solution
|
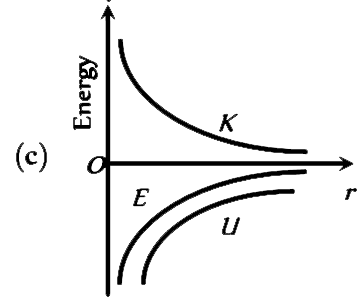
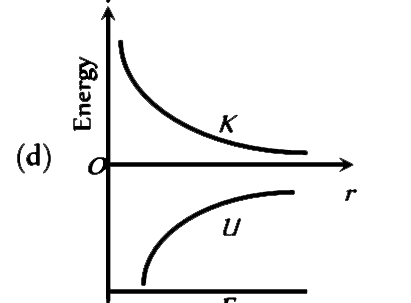
- The correct graph representing the variation of total energy (E(t)), k...
Text Solution
|
- A shell of mass M and radius R has point mass m placed at a distance r...
Text Solution
|