


Similar Questions
Explore conceptually related problems
Recommended Questions
- V-T graph of a process of monoatomic ideal gas is shown in figure. ...
Text Solution
|
- If heat is supplied to an ideal gas in an isothermal process.
Text Solution
|
- An ideal monoatomic gas undergoes the process AB as shown in the figur...
Text Solution
|
- A monoatomic ideal gas undergoes a process ABC . The heat given to the...
Text Solution
|
- One mole of an ideal monoatomic gas undergoes a process as shown in th...
Text Solution
|
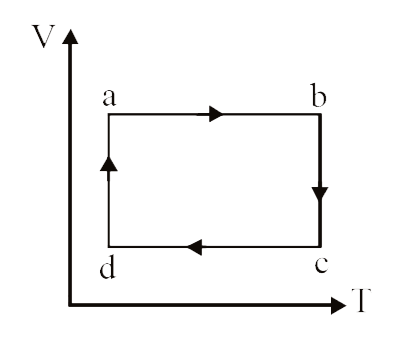
- A cyclic process of an ideal monoatomic gas is shown in figure. The co...
Text Solution
|
- V-T graph of a process of monoatomic ideal gas is shown in figure. ...
Text Solution
|
- V-T graph of a process of monoatomic ideal gas is shown in figure. Hea...
Text Solution
|
- V-T graph of a process of monoatomic ideal gas is shown in figure. Cha...
Text Solution
|