


Similar Questions
Explore conceptually related problems
Recommended Questions
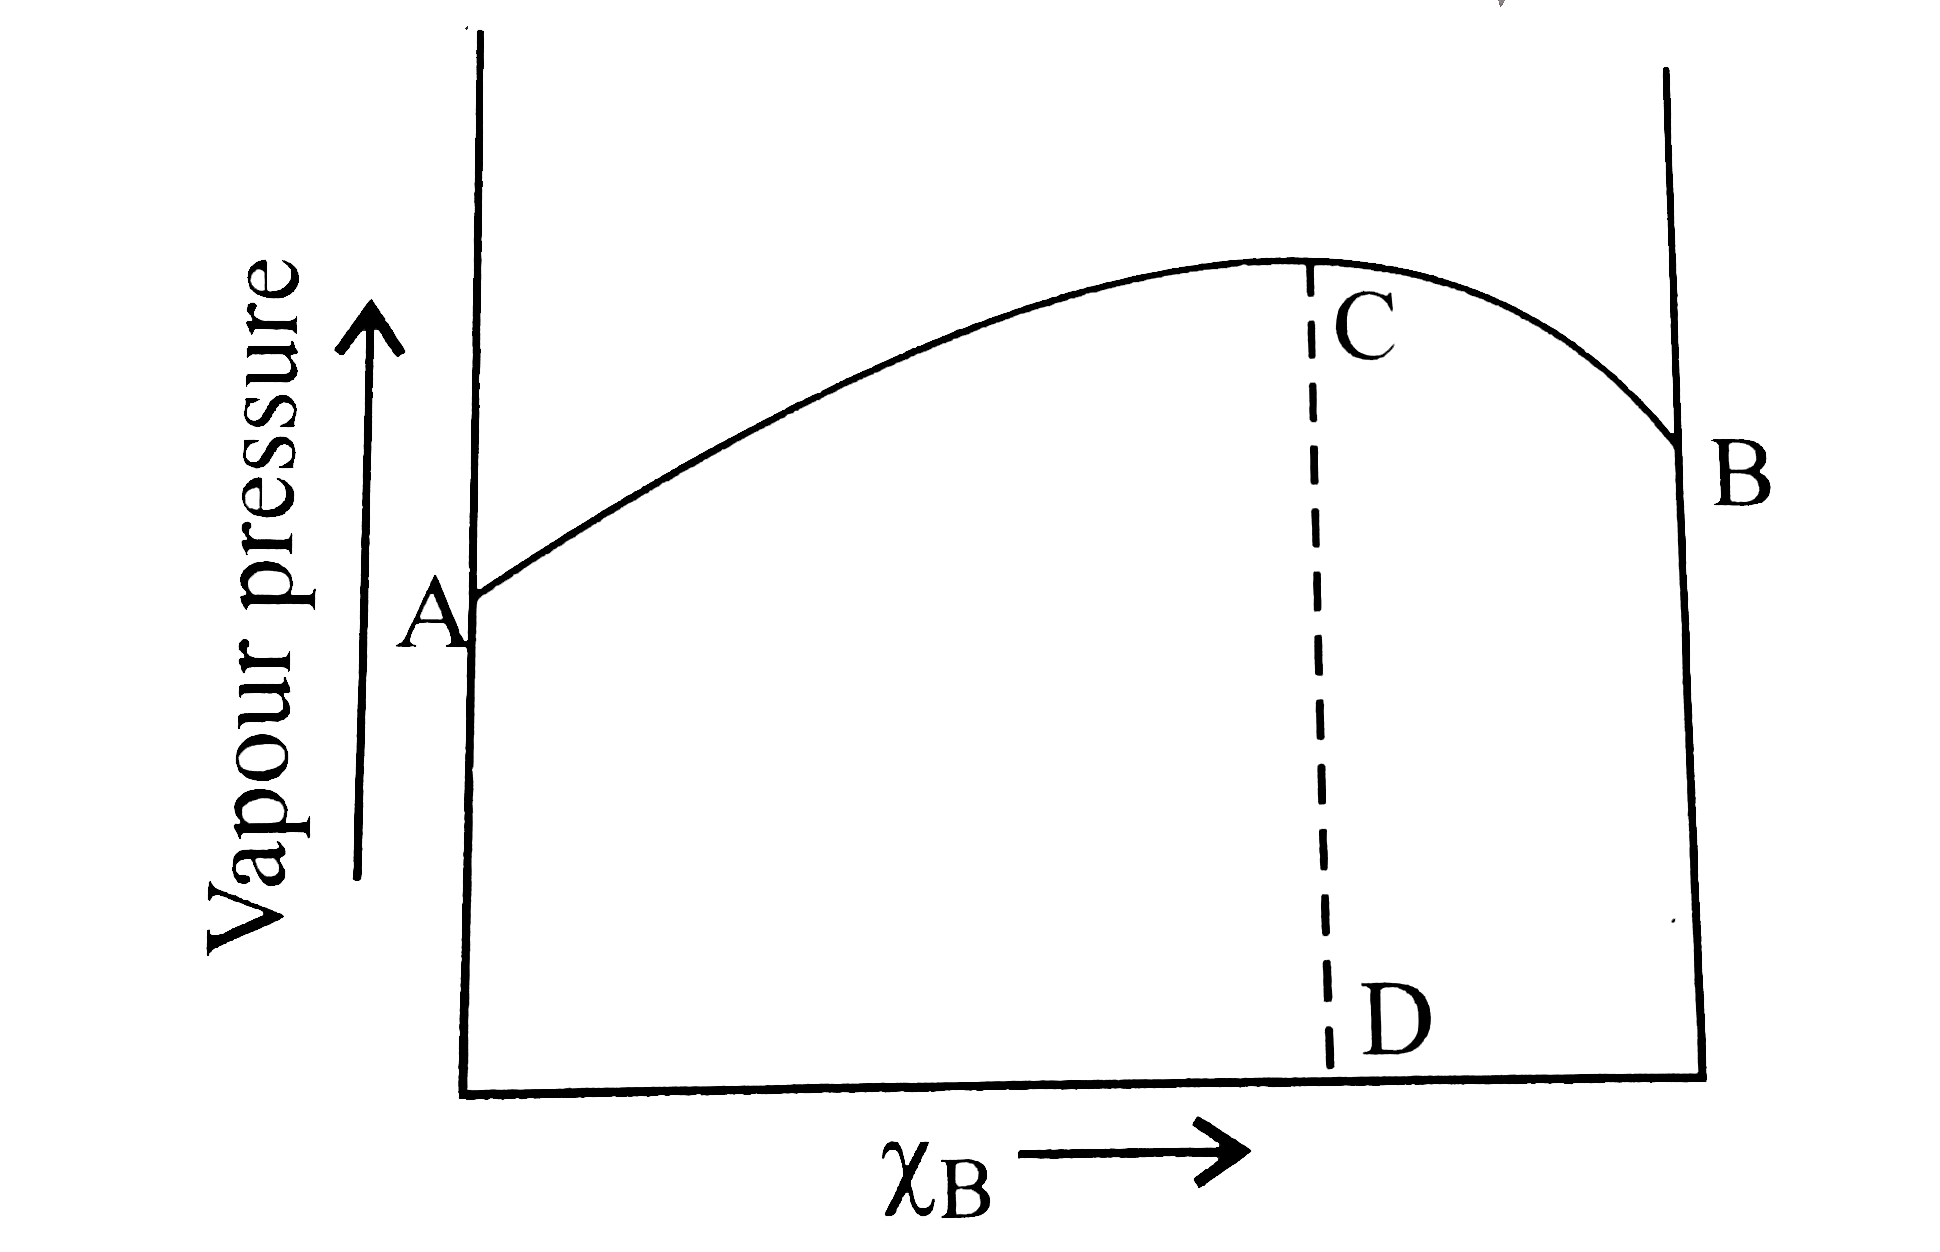
- The diagram given below is a vapour-pressure-composition diagram for a...
Text Solution
|
- The diagram given below is a vapour-pressure-composition diagram for a...
Text Solution
|
- The diagram given below is a vapour pressure composition diagram for a...
Text Solution
|
- A-B आणविक अन्तःक्रिया बालों के, A-A या B-B अन्तःक्रिया बलों के होने ...
Text Solution
|
- Assertion:In an ideal solution , Delta"mix"H is zero Reason :In an ...
Text Solution
|
- On the basic of information given below mark the Correct option .Infor...
Text Solution
|
- Assertion:In an ideal solution , Delta"mix"H is zero Reason :In an ...
Text Solution
|
- The diagram given below is a vapour-pressure-composition diagram for a...
Text Solution
|
- Give an example of a solution in which 'A-B' interaction are stronger ...
Text Solution
|