A
B
C
D
Text Solution
Verified by Experts
The correct Answer is:


Topper's Solved these Questions
TRANSMISSION OF HEAT
ERRORLESS |Exercise Assertion & Reason|24 VideosTRANSMISSION OF HEAT
ERRORLESS |Exercise ET Self Evaluation Test|23 VideosTRANSMISSION OF HEAT
ERRORLESS |Exercise Critical Thinking|36 VideosTHERMOMETRY, THERMAL EXPANSION AND CALORIMETRY
ERRORLESS |Exercise Self Evaluation Test|15 VideosUNITS, DIMENSION & MEASUREMENTS
ERRORLESS |Exercise All Questions|333 Videos
Similar Questions
Explore conceptually related problems
ERRORLESS -TRANSMISSION OF HEAT-Graphical Questions
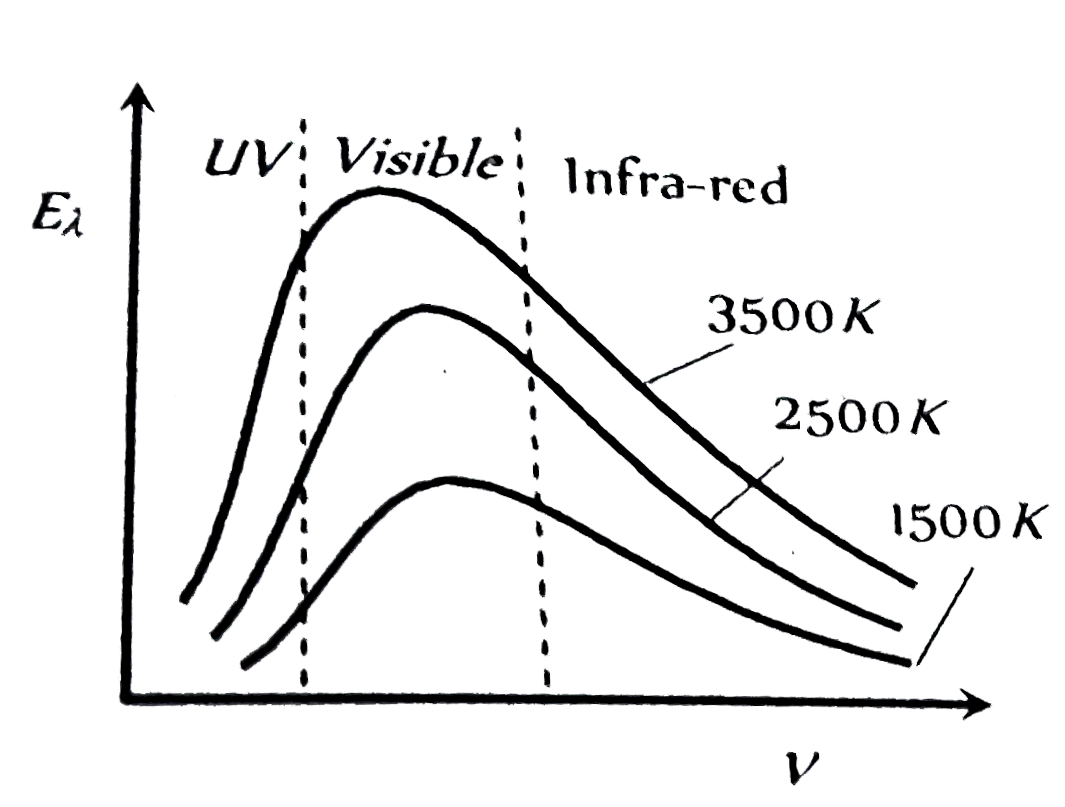
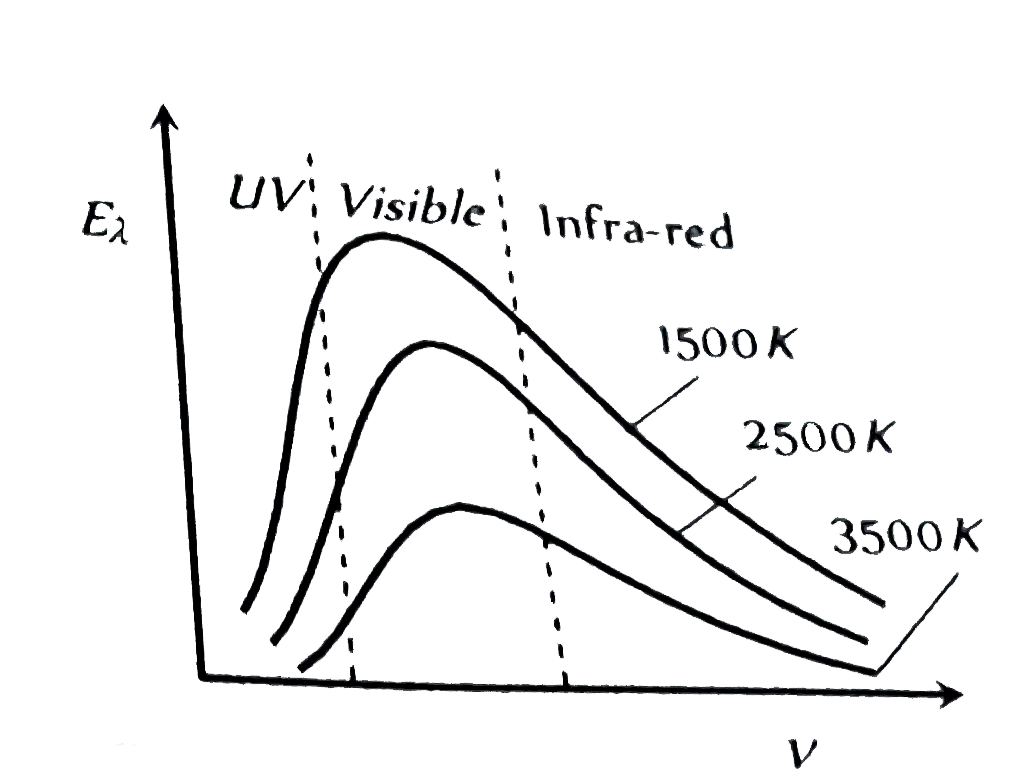
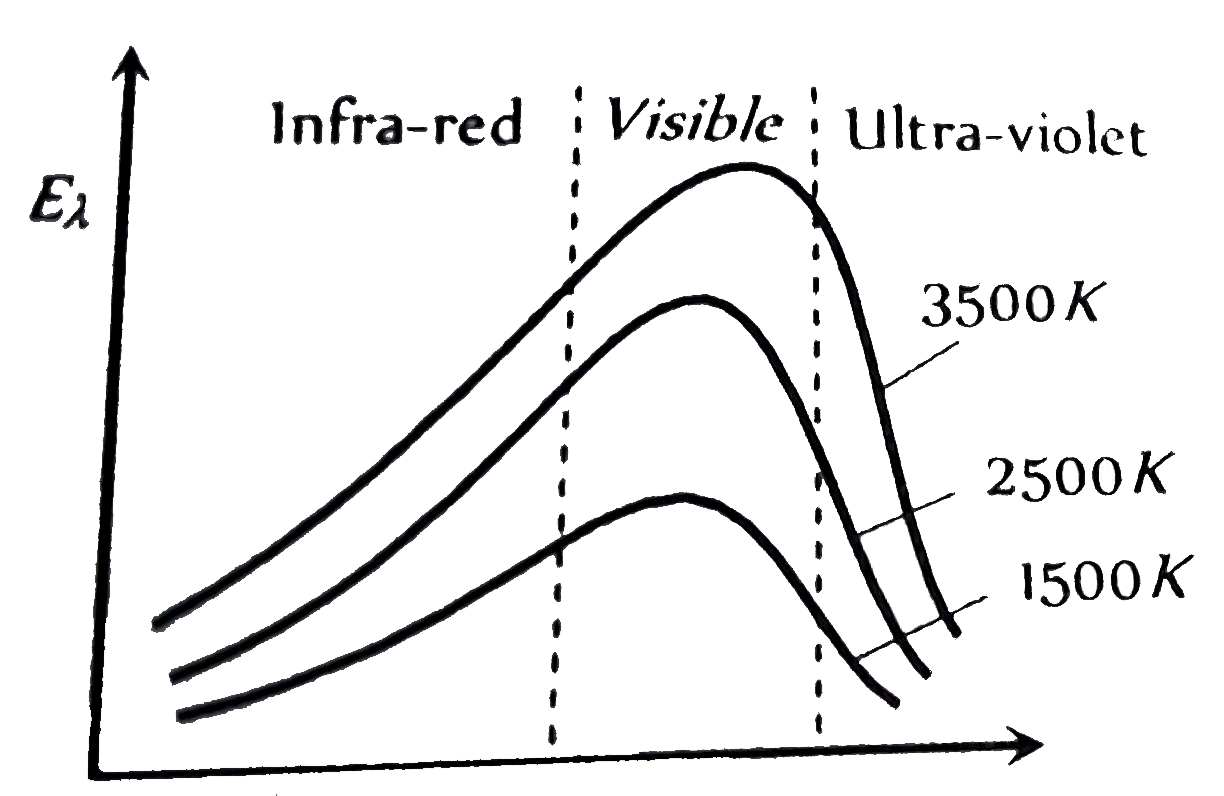
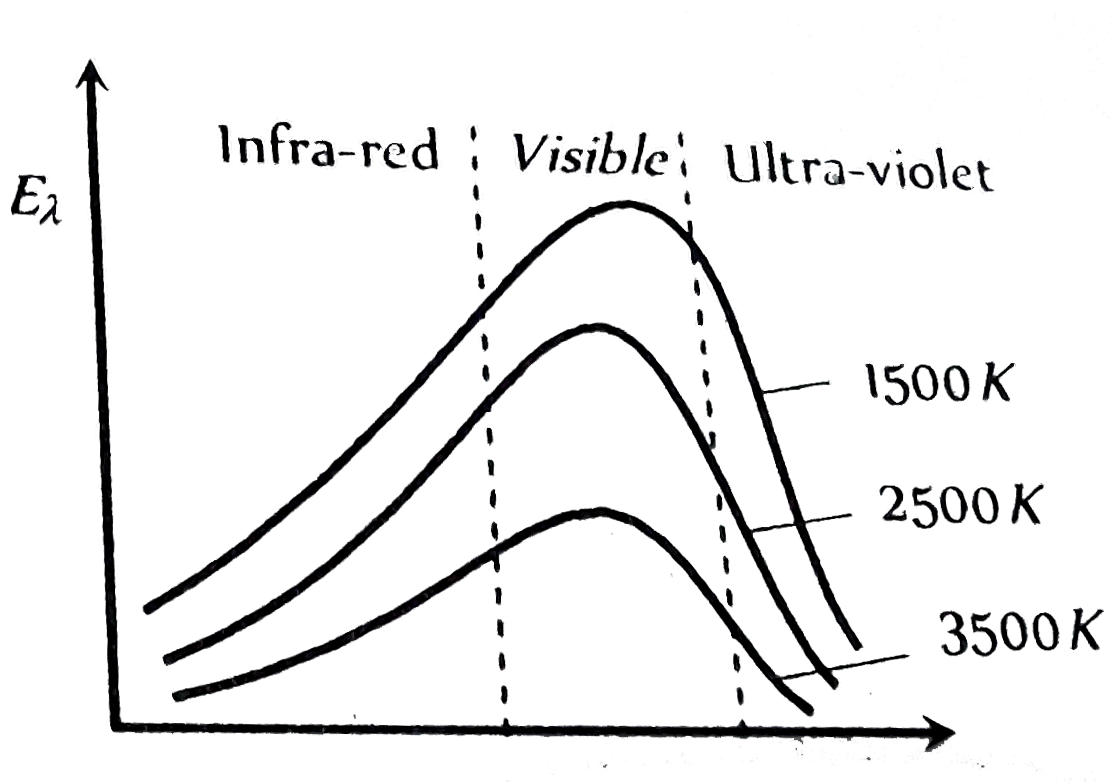
- The graph, shown in the adjacent diagram, represents the variation of ...
Text Solution
|
- The plots of intensity versus wavelength for three black bodies at tem...
Text Solution
|
- The adjoining diagram shows the spectral energy density distribution E...
Text Solution
|
- Following graph shows the correct variation in intensity of heat radia...
Text Solution
|
- Variation of radiant energy emitted by sun, filament of tungsten lamp ...
Text Solution
|
- A body cools in a surrounding which is at a constant temperature of th...
Text Solution
|
- Shown below are the black body radiation curves at temperature T(1) an...
Text Solution
|
- The spectrum of a black body at two temperatures 27^(@)C and 327^(@)C ...
Text Solution
|
- A block of metal is heated to a temperature much higher than the room ...
Text Solution
|
- The energy distribution E with the wavelength (lambda) for the black b...
Text Solution
|
- For a small temperature difference between the body and the surroundin...
Text Solution
|
- Heat is flowing through a conductor of length l from x = 0 to x = l . ...
Text Solution
|
- Radius of a conductor increases uniformly from left end to right end a...
Text Solution
|
- Which of the following graphs correctly represents the relation betwee...
Text Solution
|
- A hollow copper sphere S and a hollow copper cube C, both of negligibl...
Text Solution
|
- In the figure, the distribution of energy density of the radiation emi...
Text Solution
|
- Which of the following is the v(m) = T graph for a perfectly black bod...
Text Solution
|