A
B
C
D
Text Solution
Verified by Experts
The correct Answer is:


Topper's Solved these Questions
Similar Questions
Explore conceptually related problems
ERRORLESS -ALTERNATING CURRENT-SET
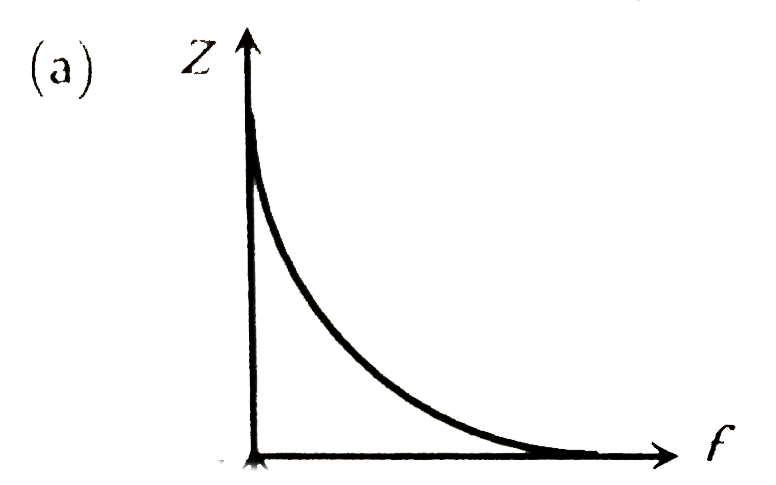
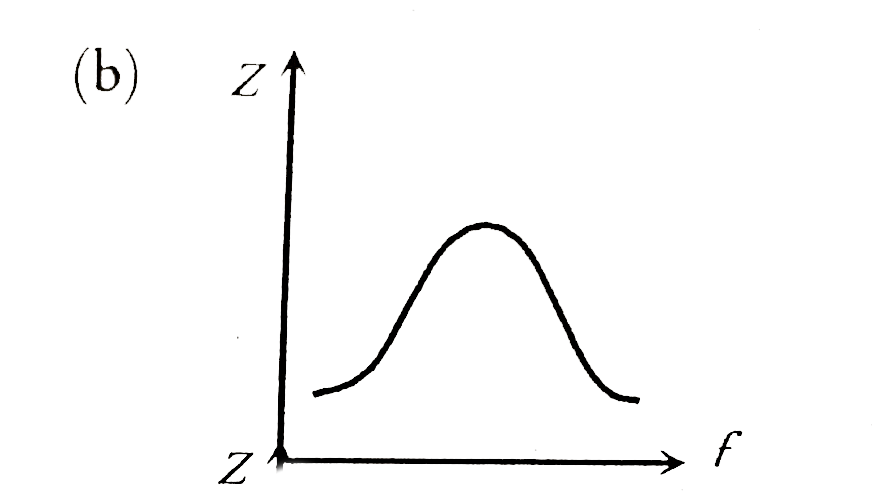
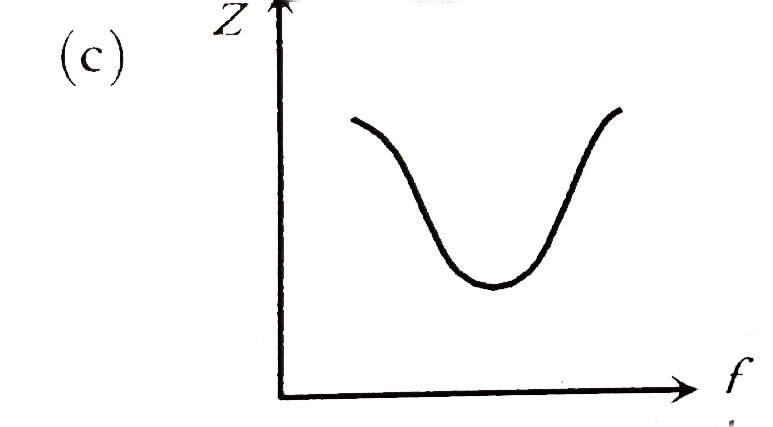
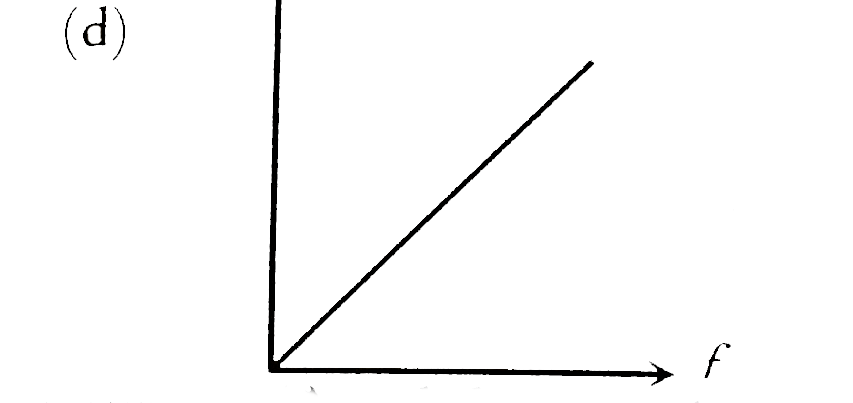
- Which of the following curves represents the variation of impedence (Z...
Text Solution
|
- A bulb and a capacitor are in series with an AC source. On increasing ...
Text Solution
|
- The r.m.s current in an AC circuit is 2A. If the wattless current be s...
Text Solution
|
- 2.5/(pi) muF capacitor and 3000-ohm resistance are joined in series t...
Text Solution
|
- The self-inductance of a choke coil is 10mH. When it is connected with...
Text Solution
|
- In an LCR circuit R=100 ohm. When capacitance C is removed, the curren...
Text Solution
|
- A group of electric lamps having a total power rating of 1000 watt is ...
Text Solution
|
- Following figure shows an AC generator to a "block box" through a pair...
Text Solution
|
- A resistor R, an inductor L and a capacitor C are connected in series ...
Text Solution
|
- If power factor is 1//2 in a series RL, circuit R=100 Omega. AC mains ...
Text Solution
|
- What will be the self-inductance of a coil, to be connected in a serie...
Text Solution
|
- The phase difference between the voltage and the current in an AC circ...
Text Solution
|
- Instantaneous values of current and e.m.f in an AC circuit are I=I//s...
Text Solution
|
- If A and B are indentical bulbs, which bulb glows brighter?
Text Solution
|
- The instantaneous values of current and voltage in an ac circuit are i...
Text Solution
|
- What is the r.m.s. value of an alternating current which when passed t...
Text Solution
|