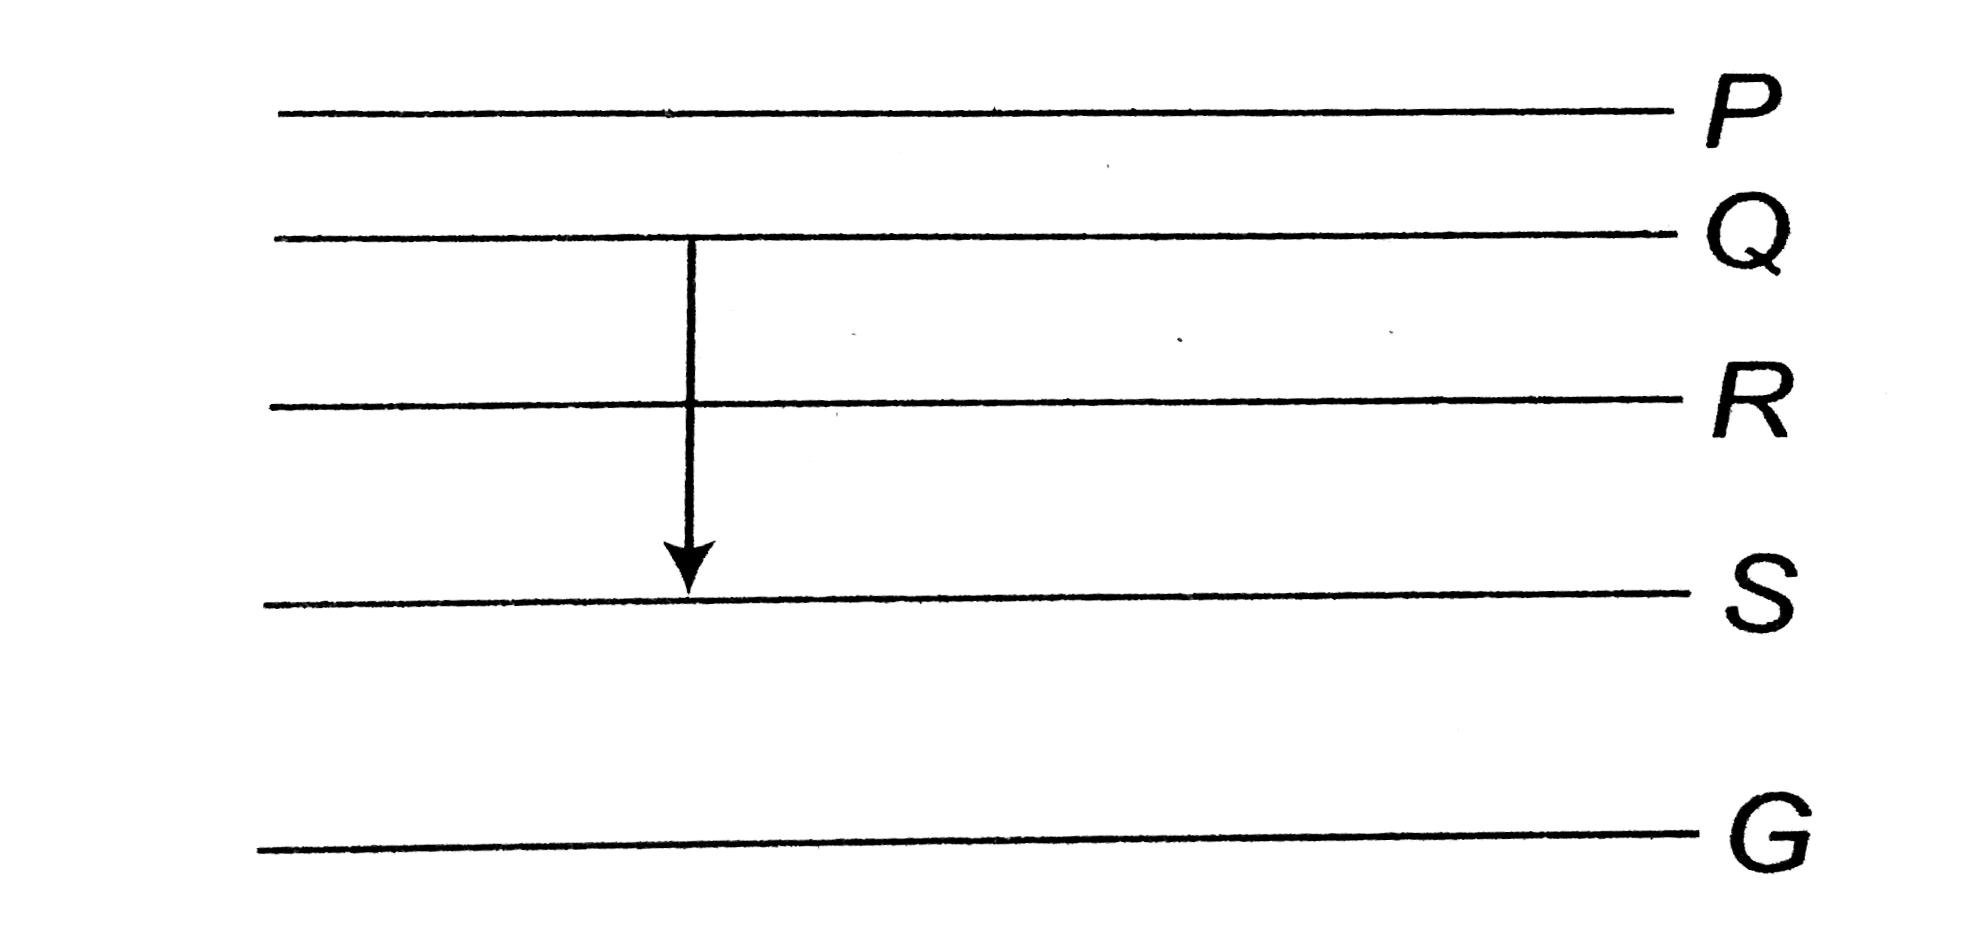
Figure shows the enegry levels `P, Q, R, S` and `G` of an atom where `G` is the ground state. A red line in the emission spectrum of the atom can be obtaned by an energy level change from `Q` so `S`. A blue line can be obtained by following energy level change
In the emission line spectra of hydrogen atom, how many lines can be accounted for by all possible electron transitions between five lowest energy levels within the atom ?
An atom has x energy level , then total number of lines in its spectrum are :
In the emission line spectra of hydrogen atom, how many lines can be accounted for all possible electronic transitions from 5^(th) energy level within the atom?
For the energy levels in atom, which one of the following statement (s) is (are) correct?
Four lowest energy levels of H -atom are shown in the figure. The number of possoble emission lines would be
Total different spectral lines observed in between 11th excited state and 3rd energy level in H-atom emission spectrum are: