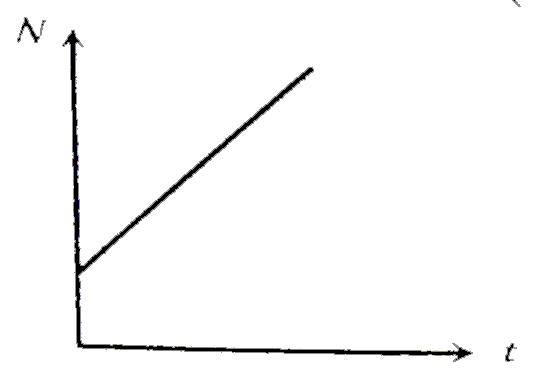
The graph between number of decayed atoms N' of a radioactive element and time t is.
99 % of a radioactive element will decay between
The graph between instantaneous velocity and acceleration of a particle performing S.H.M. is
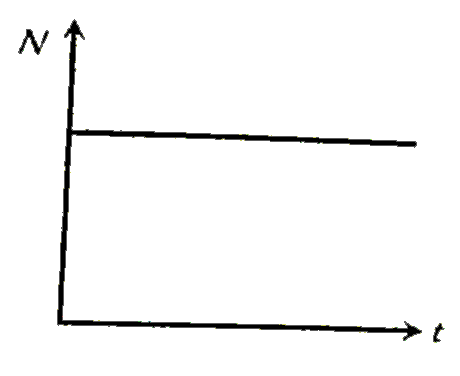
The graph plotted between concentration versus time
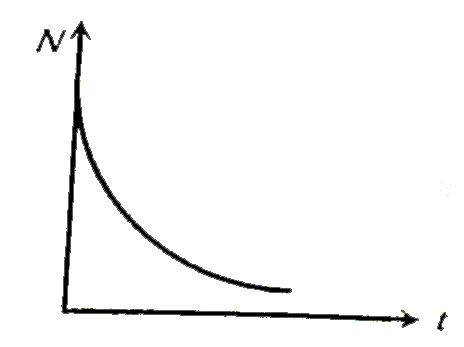
The graph between remaining radioactive atoms and time for a radioactive decay is
The graph between concentration (X) of the Product and time of the reaction Ararr B is of the type 1 . Hence, graph between -(d[A])/(dt) and time will be of the type:
The graph shows how the count-rate A of a radioactive source varies with time t. A and t are related as: (assume in (12)=2.5)
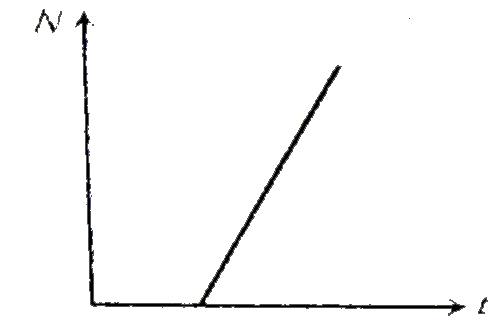
For the reaction AtoB , for which graph between half life (t_(1//2)) and initial concentration (a) of the rectant is given below Hence graph between -(d[A])/(dt) and time will be: