The activity of a radioactive sample is independent of
Write the SI unit of activity of a radioactive nuclide.
What are unit of activity of radioactive elements?
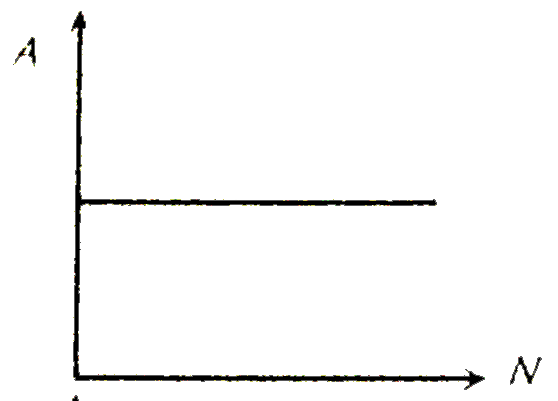
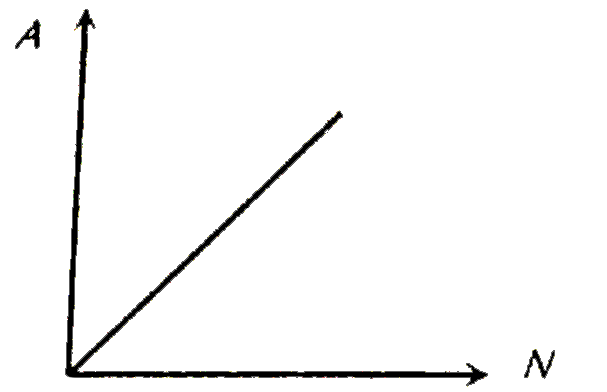
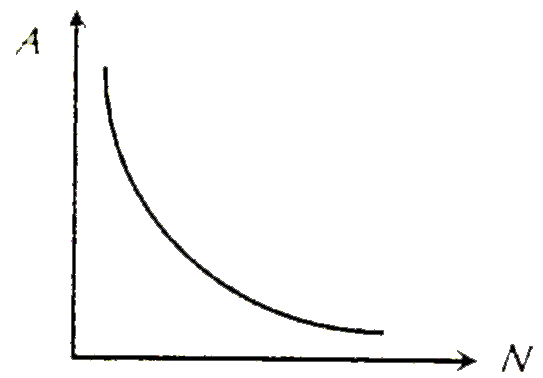
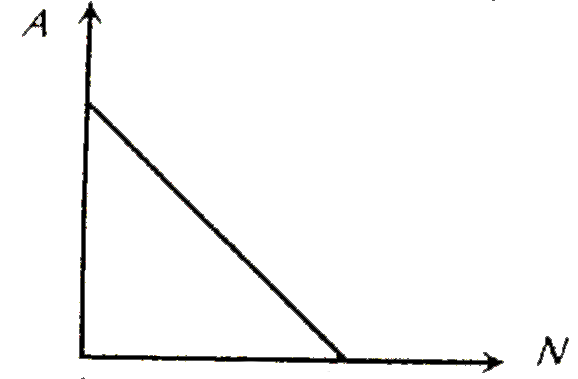
In Fig. X represents time and Y represent activity of a radioactive sample. Then the activity of sample, varies with time according to the curve
If 0.4 curie be the activity of 1 gram of radioactive samples whose atomic mass is 226, then what is the half life period the sample? (1 curie = 3.7 xx 10^(10) "dis" "sec"^(-1))
The activity of a radioactive sample initially is 3200 dps and after 8hours activity is 100 dps. What will be the activity after 4.8hr from start in dps?
The graph between number of decayed atoms N' of a radioactive element and time t is.
The graph obtained by plotting log_(e)(A) [A is the activity of a radioactive sample] against t (time) out of the following
After 280 days, the activity of a radioactive sample is 6000 dps. The activity reduces to 3000 dps after another 140 days. The initial activity of the sample in dps is