


Similar Questions
Explore conceptually related problems
Recommended Questions
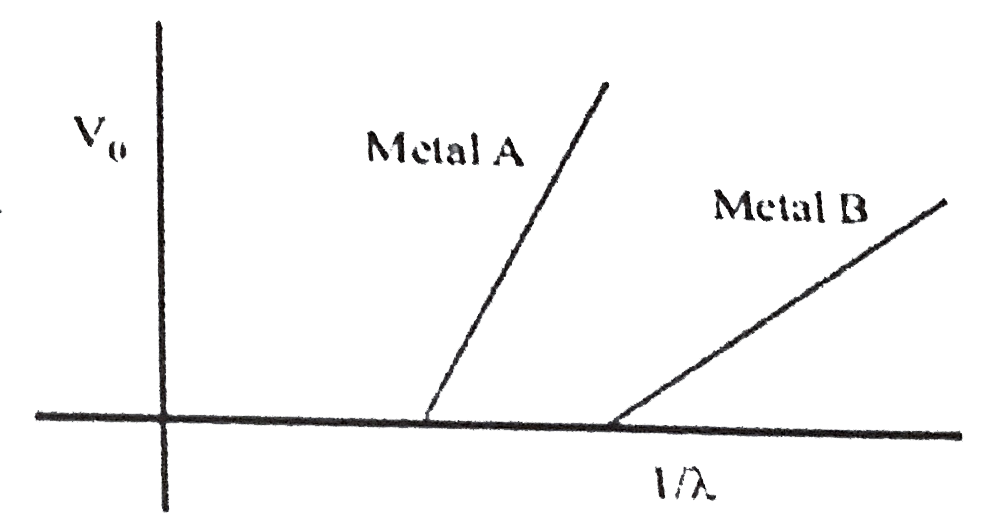
- In an experiment on photoelectric effect, a student plots stopping pot...
Text Solution
|
- In an experiment on photoelectric effect the frequency f of the incide...
Text Solution
|
- In an experiment on photoelectric effect, a student plots stopping pot...
Text Solution
|
- In photoelectric effect the slope of straight line graph between stopp...
Text Solution
|
- When a metallic surface is illuminated by a monochromatic light of lam...
Text Solution
|
- The stopping potential as a function of frequency of incident radiatio...
Text Solution
|
- When light of wavelength lamda and 2 lamda are incident on a metal sur...
Text Solution
|
- A certain, metallic surface is illuminated with monochromatic light of...
Text Solution
|
- In an experiment of photoelectric effect the stopping potential was me...
Text Solution
|