


Similar Questions
Explore conceptually related problems
Recommended Questions
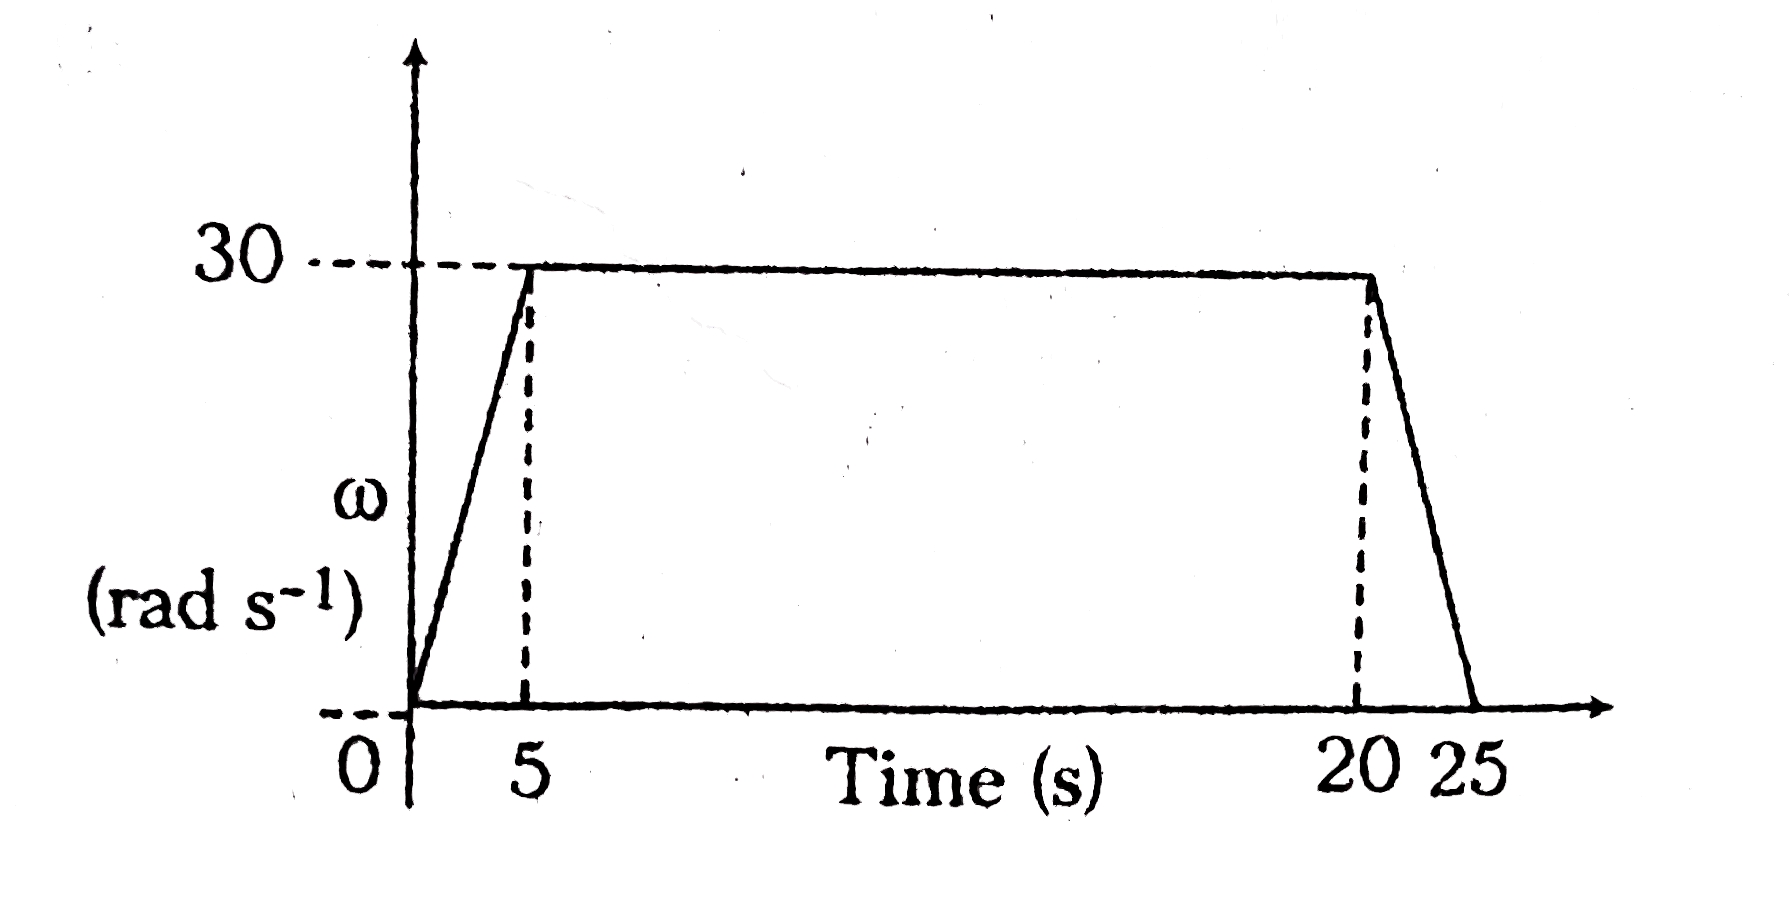
- The figure shows the angular velocity versus time graph of a flywheel....
Text Solution
|
- A flywheel with the initial angular velocity omega0 decelerates due to...
Text Solution
|
- The figure shows the angular velocity versus time graph of a flywheel....
Text Solution
|
- A flywheel at rest is to reach an angular velocity of 24 rad/s in 8 se...
Text Solution
|
- एक चक्का अपने अक्ष के परितः omega1 कोणीय वेग से घूम रहा है। अक्ष के प...
Text Solution
|
- A flywheel revolves at 100 rev/min, a torque is applied to the flywhee...
Text Solution
|
- Angular displacement ( theta ) of a flywheel varies with time as theta...
Text Solution
|
- A flywheel at rest is reached to an angular velocity of 36 rad//s in ...
Text Solution
|
- The angle turned through by the flywheel of a generator during a time ...
Text Solution
|