Home
Class 12
PHYSICS
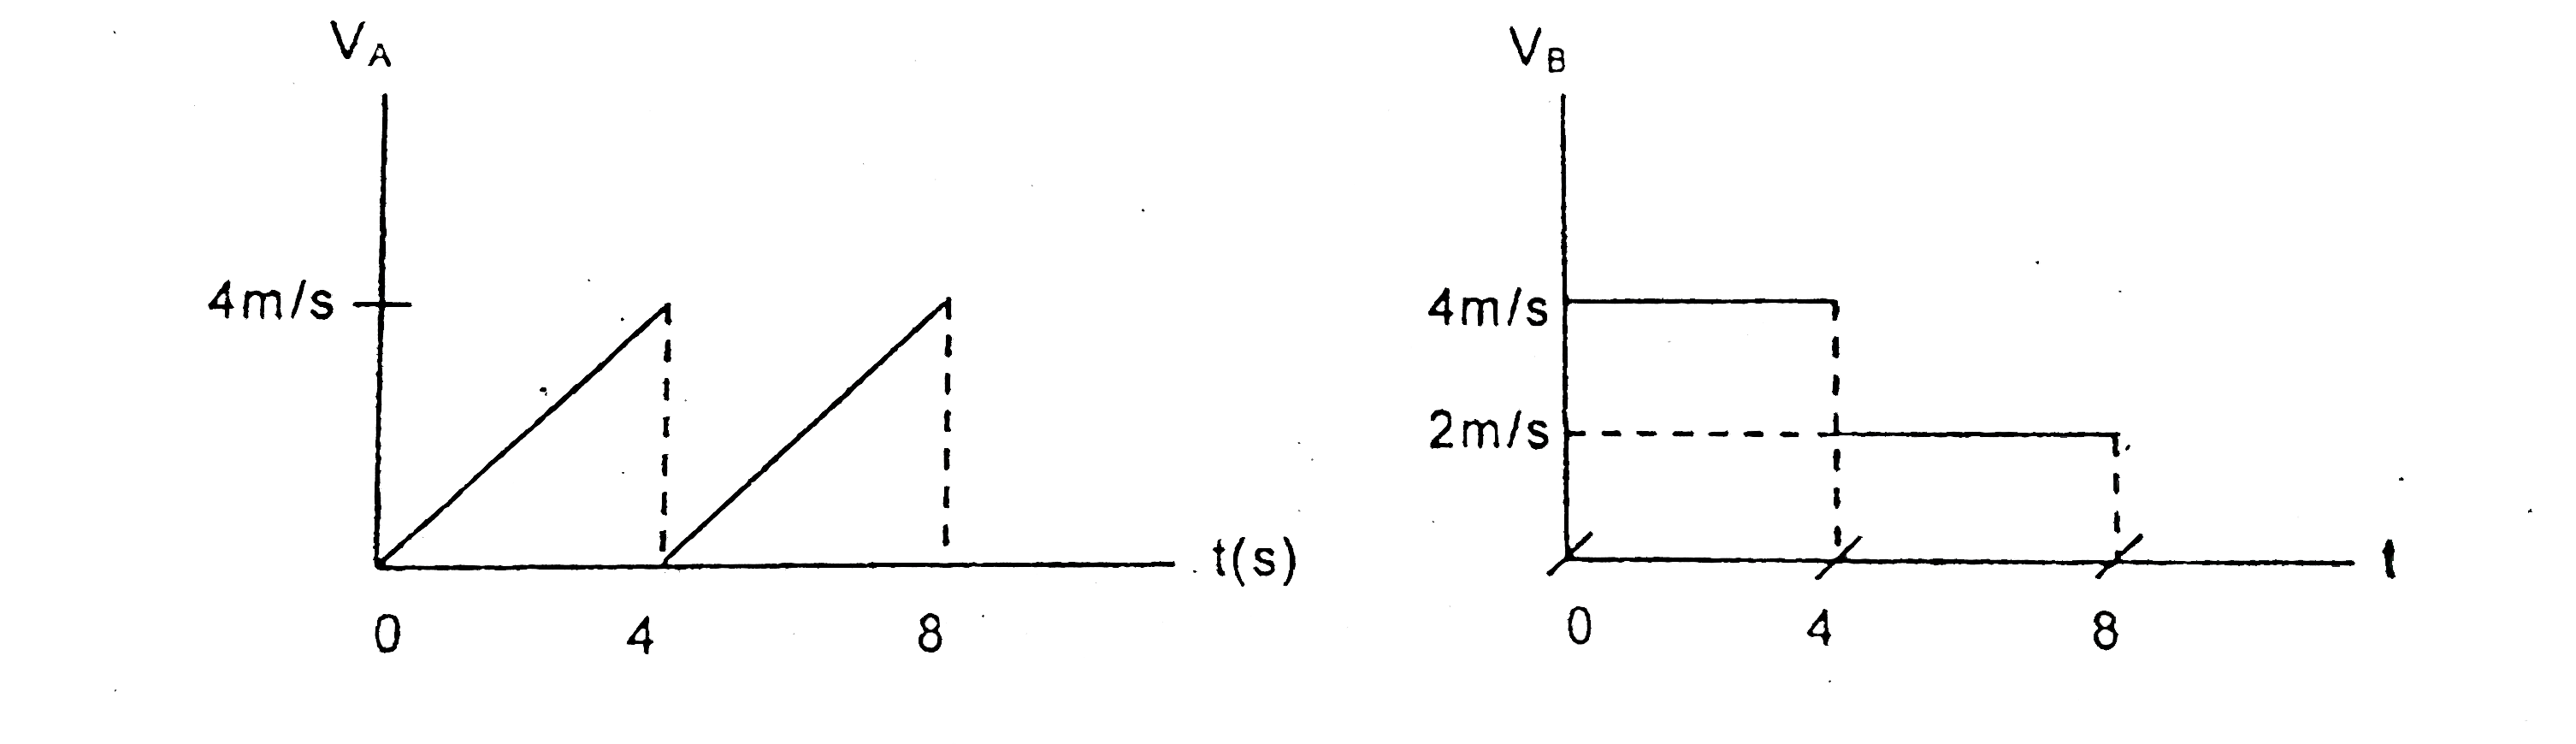
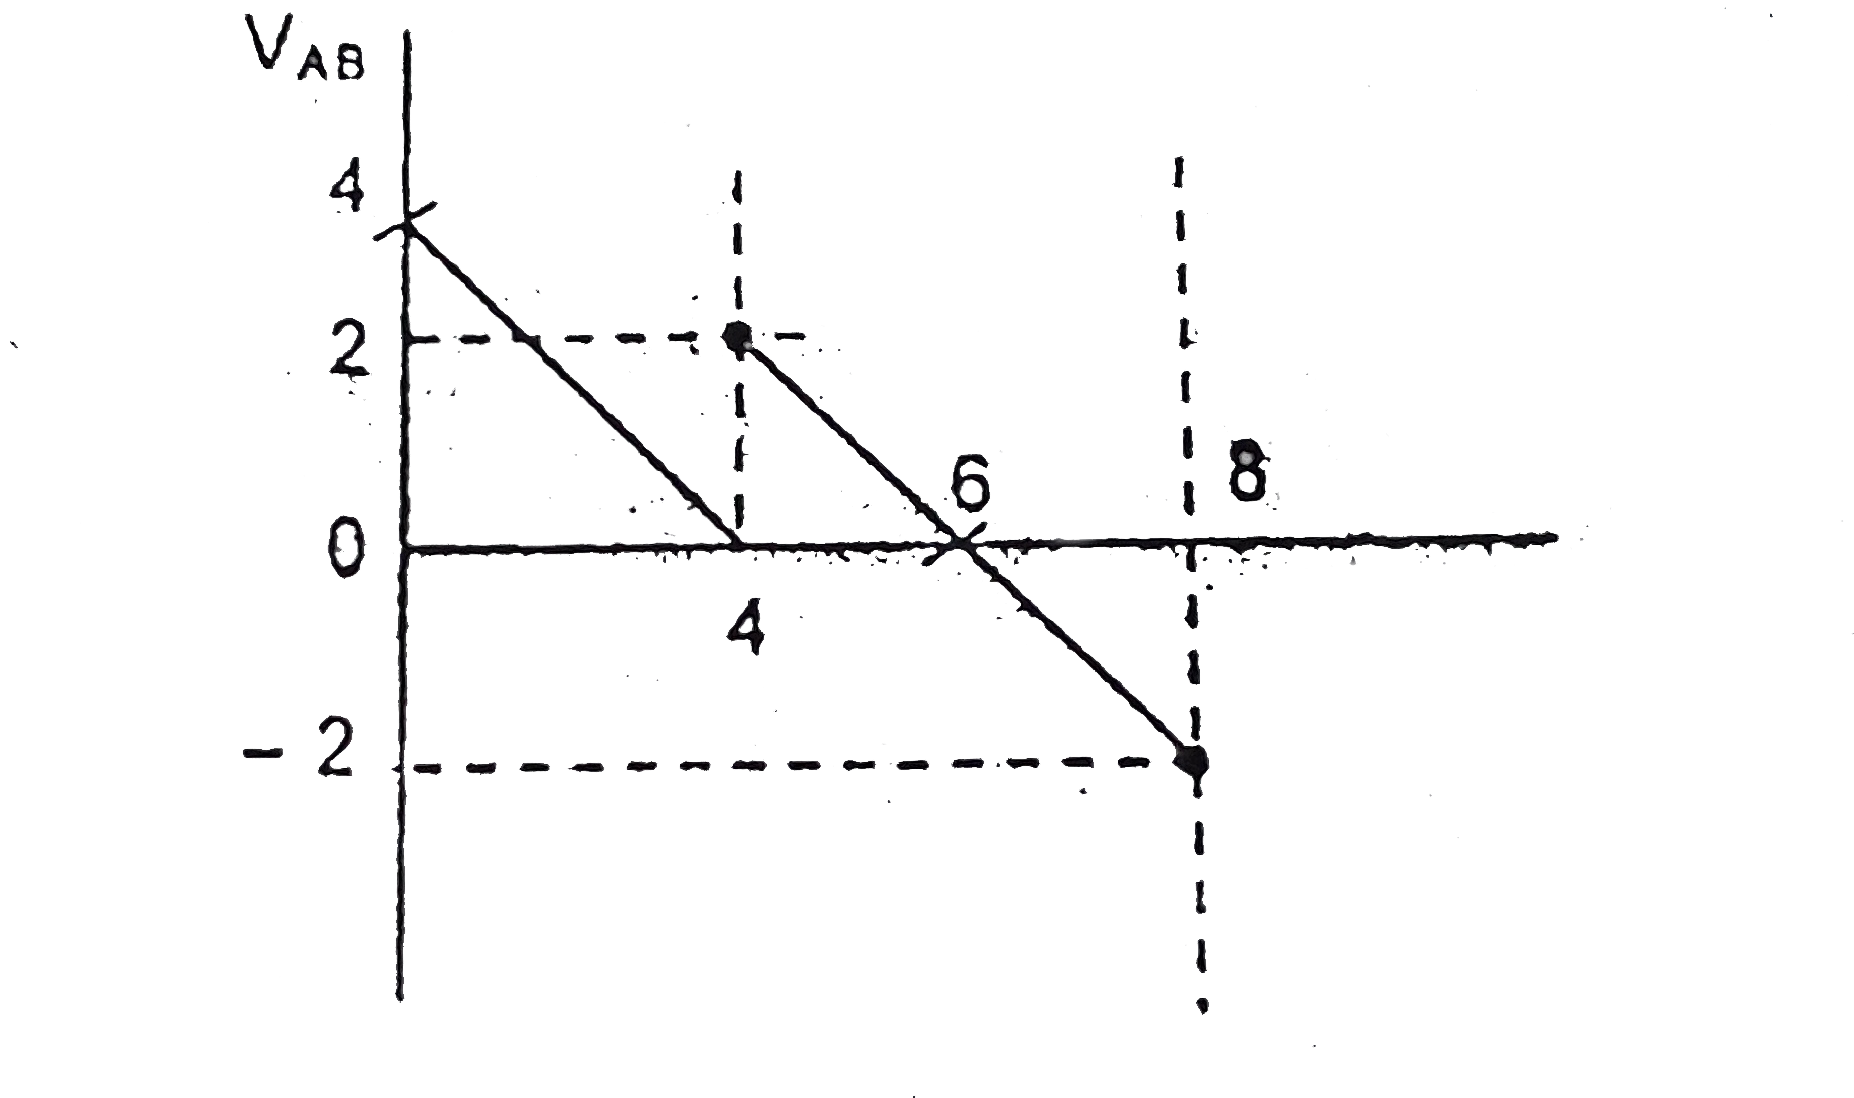
Velocity time graphs of particles A and ...

Velocity time graphs of particles `A` and `B` moving along `x`-axis are shown here. Both `A` and `B` start from origin:

A

Maximum separation between the particles is `8m`

B

Maximum separation between the particles is `10m`

C

Maximum separation between the particles occurs at `t=6s`

D

Maximum separation between the particles occurs at `t=8s`

Text Solution

Verified by Experts

The correct Answer is:
B, C


From the relative velocity graph, maximum separation will be at `t=6`, second and is given by area under the graph between`t=0` and `t=6` second.
Promotional Banner

Similar Questions

Explore conceptually related problems

The velocity time graph for two particles (1 and 2) moving along X axis is shown in fig. At time t = 0 , both were at origin. (a) During first 4 second of motion what is maximum separation between the particles? At what time the separation is maximum? (b) Draw position (x) vs time (t) graph for the particles for the given interval.

The velocity time graph for a particle moving along X-axis is shown in the figure. The corresponding displacement time graph is correctly shown by

The velocity time graph for a particle moving along x-axis is shown in the figure. The corresponding displacement time graph is correctly shown by

The velocity versus time graph of two particles moving along x-axis varies are shown in the following two plots. Then

The acceleration-time graph of a particle moving along x-axis is shown in the figure. If the particle starts with velocity 3 m/s at t = 0, find the velocity of particle at t = 4 s.

The velocity (v) - time (t) graph for a particle moving along x - axis is shown in the figure. The corresponding position (x) - time (t) is best represented by

The velocity-time graph for a particle moving along X-axis is shown in the figure. The corresponding displacement-time graph is correctly shown by

The velocity-time graph of a particle in straight line motion is veloity-time graph of a particle in straight line motion is shown in. The particle starts its motion from origin. . The distance of the particle from the origin after 8 s is .

The velocity (V) – time (t) graphs for two particles A and B moving rectilinearly have been shown in the figure for an interval of 2 second. (a) At t = 1 s , which of the two particles (A or B) has received a severe blow? (b) Draw displacement (X) – time (t) graph for both of them.