


ERRORLESS -THERMODYNAMICS-All Questions
- A system is taken through a cyclic process represented by a circle as ...
Text Solution
|
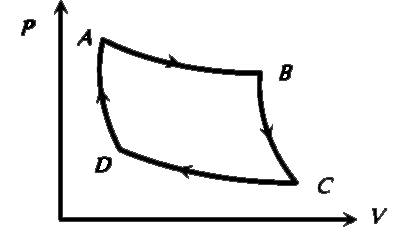
- A thermodynamic system undergoes cyclic process ABCDA as shown in figu...
Text Solution
|
- The P - V graph of an ideal gas cycle is shown here as below. The adia...
Text Solution
|
- An ideal monoatomic gas is taken the cycle ABCDA as shown in following...
Text Solution
|
- A system changes from the state (P(1),V(1)) to (P(2)V(2)) as shwon in ...
Text Solution
|
- Carbon monoxide is carried around a closed cyclic processes abc, in wh...
Text Solution
|
- A sample of an ideal monoatomic gas is taken round the cycle ABCA as s...
Text Solution
|
- When a system is taken from state f along path iaf, Q = 50 J and W = 2...
Text Solution
|
- For one complete cycle of a thermodynamic process gas as shown in the ...
Text Solution
|
- An ideal gas is taken around ABCA as shown in the above P - V diagram....
Text Solution
|
- An ideal gas is taken from point A to the point B, as shown in the P-V...
Text Solution
|
- The P - V diagram of a system undergoing thermodynamic transformation ...
Text Solution
|
- Consider a process shown in the figure. During this process the work d...
Text Solution
|
- Six moles of an ideal gas performs a cycle shown in figure. If the tem...
Text Solution
|
- Which of the following P-V diagrams best represents an isothermal proc...
Text Solution
|
- In the following figure, four curves A,B, C and D are shown. The curve...
Text Solution
|
- P - V diagram of a cyclic process ABCA is as shown in Fig. Choose the ...
Text Solution
|
- A sample of an ideal gas is taken through the cyclic process abca . It...
Text Solution
|
- In the following P-V diagram two adiabatics cut two isothermals at tem...
Text Solution
|
- Assertion: Reversible systems are difficult to find in real world. R...
Text Solution
|