A
B
C
D
Text Solution
Verified by Experts
The correct Answer is:


Topper's Solved these Questions
ELECTRON, PHOTON, PHOTOELECTRIC EFFECT AND X-RAYS
ERRORLESS |Exercise Cathode Rays and Positive Rays|11 VideosELECTRON, PHOTON, PHOTOELECTRIC EFFECT AND X-RAYS
ERRORLESS |Exercise Photon and Photoelectric Effect|4 VideosELECTRO MAGNETIC INDUCTION
ERRORLESS |Exercise SET|20 VideosELECTRONICS
ERRORLESS |Exercise Selv Evaluation Test|23 Videos
Similar Questions
Explore conceptually related problems
ERRORLESS -ELECTRON, PHOTON, PHOTOELECTRIC EFFECT AND X-RAYS-Self Evaluation Test
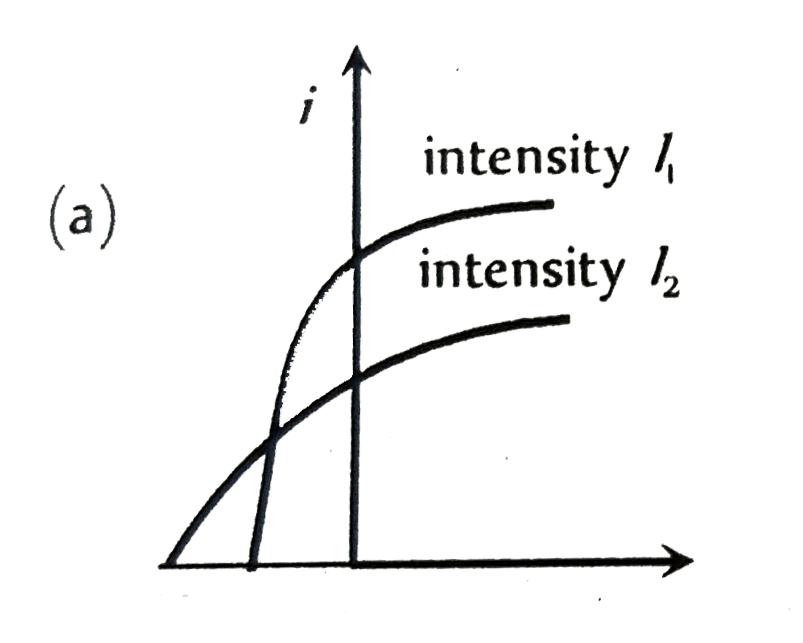
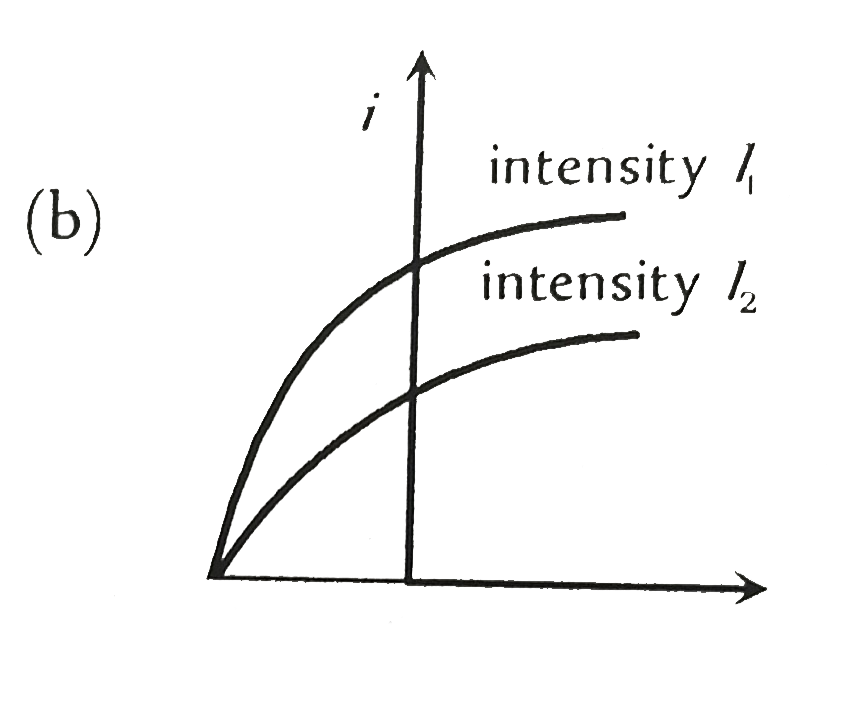
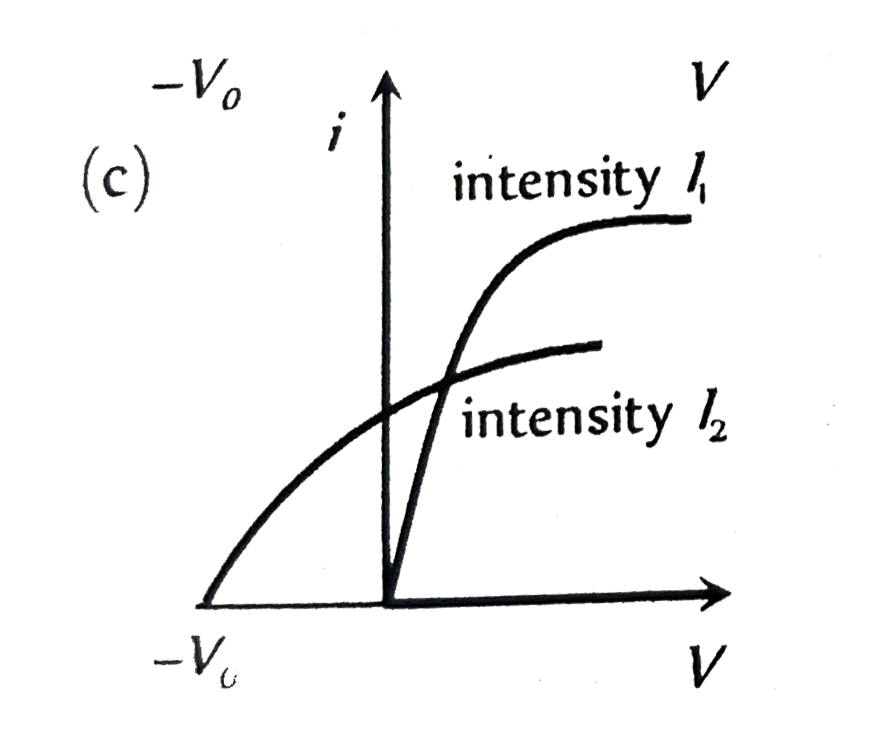
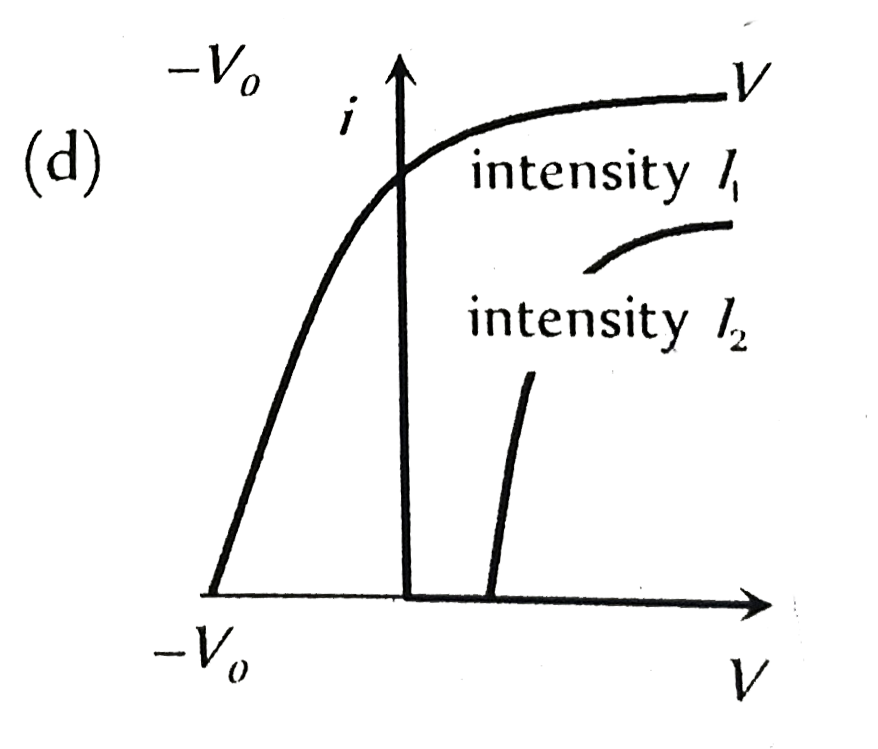
- The curves (a) , (b) , ( c ) and (d) show the variation between the ap...
Text Solution
|
- If a voltage to an X-ray tube is increased to 1.5 times the minimum wa...
Text Solution
|
- If the potential difference between the anode and cathode of the X-ray...
Text Solution
|
- The collector plate in an experiment on photoelectric effect is kept v...
Text Solution
|