


Similar Questions
Explore conceptually related problems
Recommended Questions
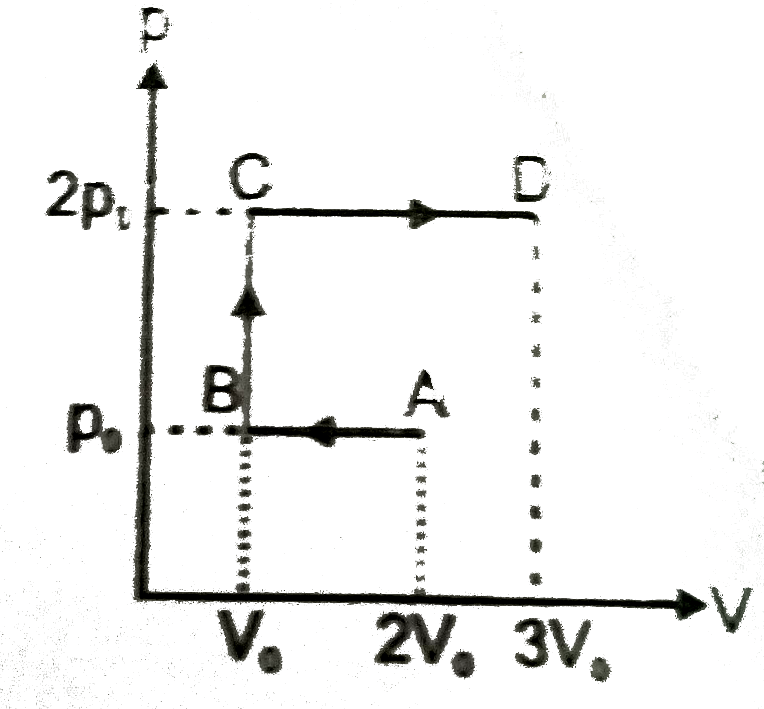
- P-V indicator diagram for a given sample of monoatomic idela gas is sh...
Text Solution
|
- Method 1 of Q Temperature of two moles of a monoatomic gas is increase...
Text Solution
|
- Find the molar specific heat of the process p=a/T for a monoatomic gas...
Text Solution
|
- One mole of an ideal monoatomic gas undergoes a process as shown in th...
Text Solution
|
- For an ideal monoatomic gas, molar heat capacity at constant volume (C...
Text Solution
|
- One mole of a monoatomic ideal gas undergoes the process ArarrB in the...
Text Solution
|
- Find the molar heat capacity (in terms of R) of a monoatomic ideal gas...
Text Solution
|
- P-V indicator diagram for a given sample of monoatomic idela gas is sh...
Text Solution
|
- In the figure n mole of a monoatomic ideal gas undergo the process ABC...
Text Solution
|