


Similar Questions
Explore conceptually related problems
Recommended Questions
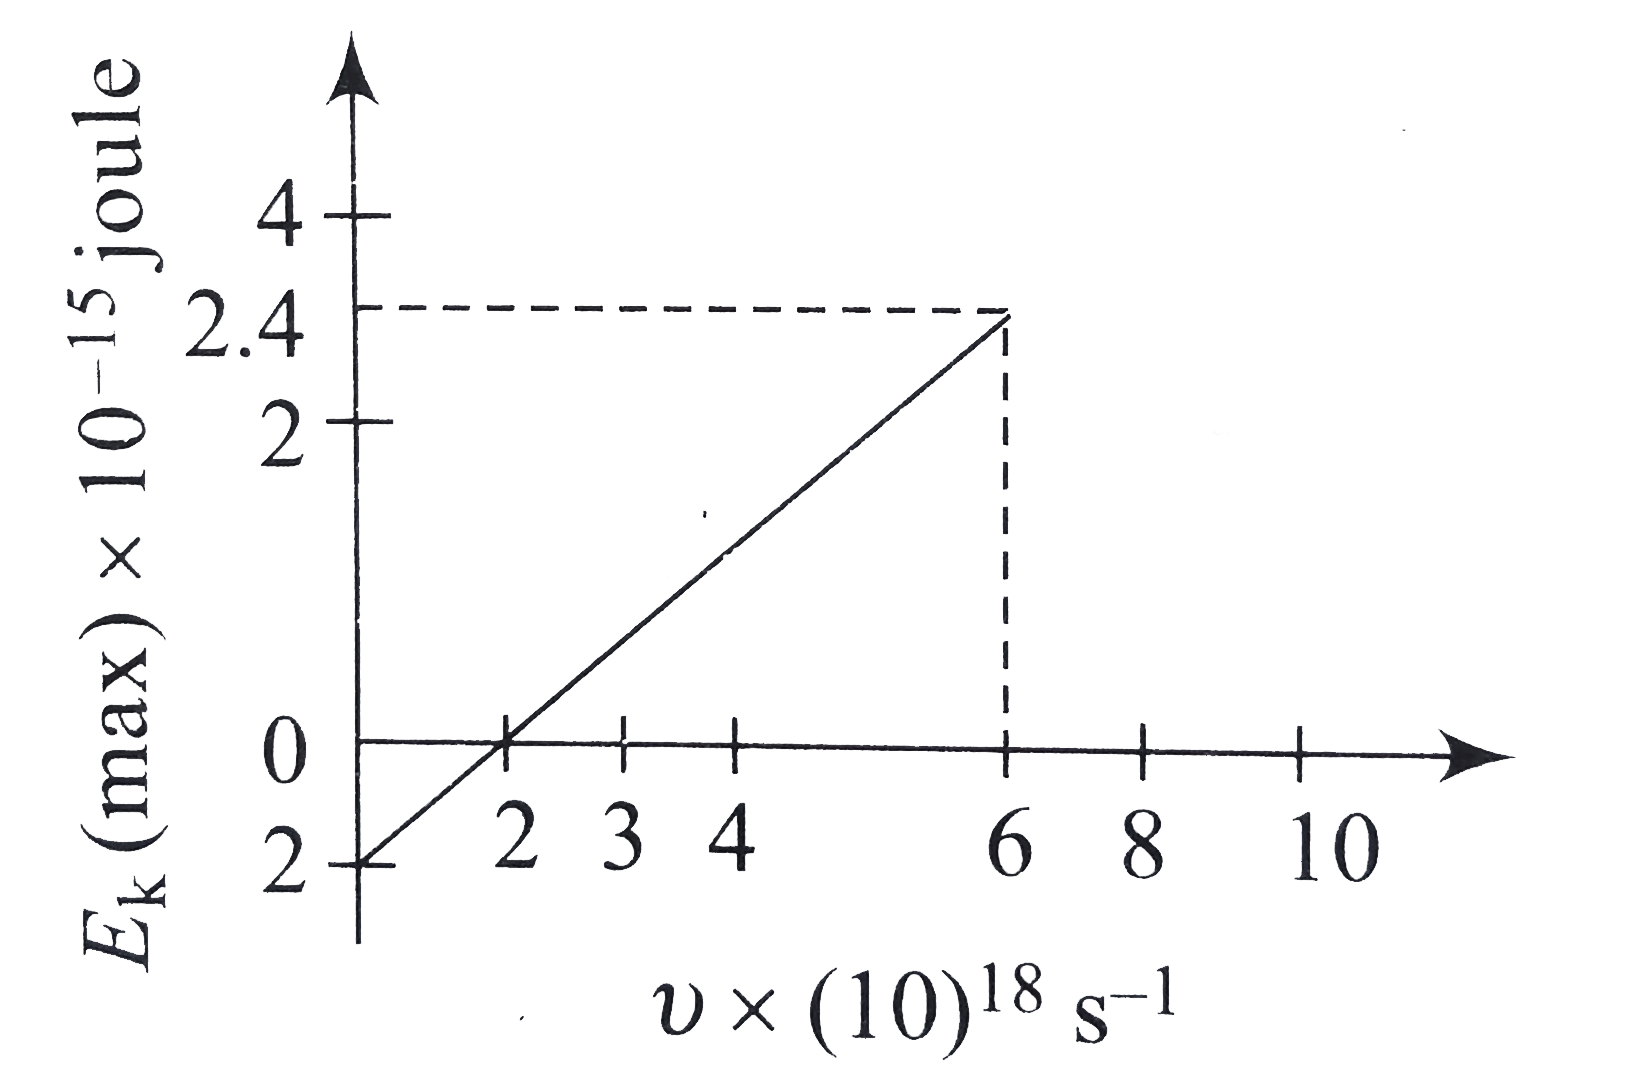
- In the experiment on photoelectric effect, the graph between EK(max) a...
Text Solution
|
- In the experiment on photoelectric effect, the graph between EK(max) a...
Text Solution
|
- In photo electric effect, the slope of the straight line graph between...
Text Solution
|
- In photoelectric effect the slope of straight line graph between stopp...
Text Solution
|
- In a photoelectric experiment, the graph of frequency v of incident li...
Text Solution
|
- In photoelectric effect the slope of straight line graph between stopp...
Text Solution
|
- In a photoelectric experiment, the reciprocal of the slope of the st...
Text Solution
|
- Draw a graph to show the dependence of stopping potential on the frequ...
Text Solution
|
- In photoelectric effect the slope of stop of stopping potential vers...
Text Solution
|