


Similar Questions
Explore conceptually related problems
Recommended Questions
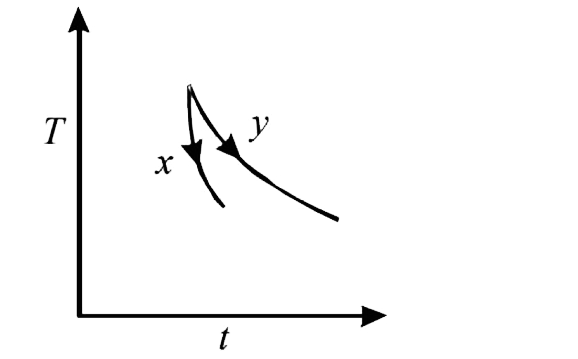
- The graph, shown in the adjacent diagram, represents the variation of ...
Text Solution
|
- The graph, shown in the adjacent diagram, represents the variation of ...
Text Solution
|
- At a given temperature the ratio between emissive power and absorptive...
Text Solution
|
- Two bodies of same shape, same size and same radiating power have emis...
Text Solution
|
- If the rate of emission of radiation by a body at temperature TK is E ...
Text Solution
|
- Two bodies A and B have emissivities 0.5 and 0.8 respectively. At some...
Text Solution
|
- Relation between emissivity e and absorptive power a is (for black bod...
Text Solution
|
- The graph shown in the adjacement diagram represents the variation of ...
Text Solution
|
- चित्र में प्रदर्शित वक्र, दो वस्तुओं (x व y) जिनके पृष्ठ क्षेत्रफल समा...
Text Solution
|