A
B
C
D
Text Solution
Verified by Experts
The correct Answer is:


Topper's Solved these Questions
ELECTRIC CURRENT & CIRCUITS
CENGAGE PHYSICS|Exercise Combination of Resistance 1|14 VideosELECTRIC CURRENT & CIRCUITS
CENGAGE PHYSICS|Exercise Combination of Resistance 2|14 VideosELECTRIC CHARGES AND FIELDS
CENGAGE PHYSICS|Exercise QUESTION BANK|40 VideosELECTRIC CURRENT AND CIRCUIT
CENGAGE PHYSICS|Exercise Interger|8 Videos
Similar Questions
Explore conceptually related problems
CENGAGE PHYSICS-ELECTRIC CURRENT & CIRCUITS-Kirchhoff s law and simple circuits
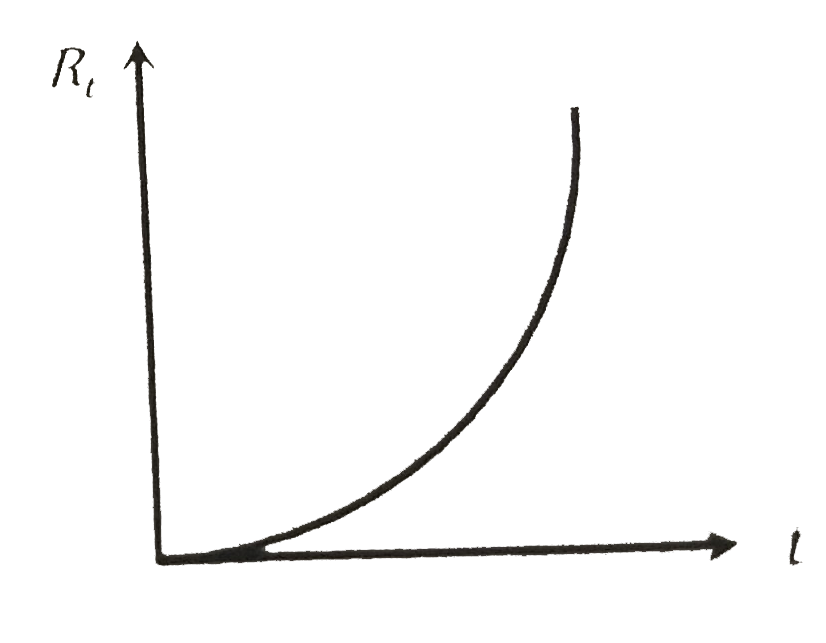
- The resistance R of a conductor varies with temperature t as shown i...
Text Solution
|
- In the circuit element given here, if the potential at point B = V(B) ...
Text Solution
|
- The magnitude in i in ampere unit is
Text Solution
|
- If in the circuit shown below, the internal resistance of the battery ...
Text Solution
|
- In the circuit shown below E(1) = 4.0 V, R(1) = 2 Omega, E(2) = 6.0 V,...
Text Solution
|
- Consider the circuit shown in the figure. Both the circuits are taking...
Text Solution
|
- Current through XY of circuit shown is
Text Solution
|
- In the circuit of adjoining figure the current through 12 Omega resist...
Text Solution
|
- The circuit is shown in the following figure. The potential at points ...
Text Solution
|
- In the circuit as shown if the current drawn through battery is 0.5A. ...
Text Solution
|
- Consider a simple circuit shown in Fig. 2(ET).2. stands for a variable...
Text Solution
|
- The circuit consists of resistors and ideal cells. I(1) and I(2) are c...
Text Solution
|
- The circuit consists of resistors and ideal cells. I(1) and I(2) are c...
Text Solution
|
- In the given circuit, if resistance of each resistor is R: Find t...
Text Solution
|
- In the given circuit, if resistance of each resistor is R: How mu...
Text Solution
|
- In the given circuit, if resistance of each resistor is R: The eq...
Text Solution
|