A
B
C
D
Text Solution
Verified by Experts
The correct Answer is:


Similar Questions
Explore conceptually related problems
Recommended Questions
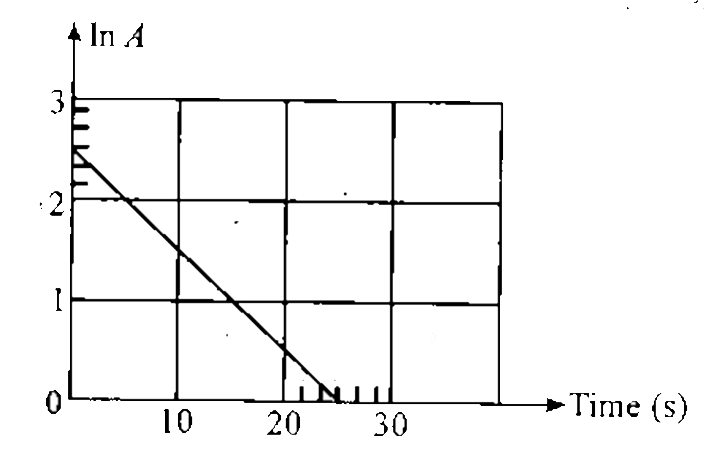
- The graph shows how the count-rate A of a radioactive source varies wi...
Text Solution
|
- The count rate observed from a radioactive source at t second was N0 a...
Text Solution
|
- The graph shows how the count-rate A of a radioactive source varies wi...
Text Solution
|
- Using a nuclear counter the count rate of emitted particles from a rad...
Text Solution
|
- The initial count rate for a radioactive source was found to be 1600 c...
Text Solution
|
- Using a nuclear counter the count rate of emitted particles from a rad...
Text Solution
|
- The counting rate observed from the radioactive source at t= 0 second ...
Text Solution
|
- The counting rate observed from a radioactive source at t = 0 seconds ...
Text Solution
|
- Using a nuclear counter the count rate of emitted particles from a rad...
Text Solution
|