Home
Class 12
MATHS
The graph above shows how the value of a...


The graph above shows how the value of a stock has increased over time. The line of best fit is shown.
a. The value of the stock increased from June 2000 to Jone 2005 by approcimately what percent?

A

0.16

B

0.2

C

0.25

D

0.28

Text Solution

Verified by Experts

The correct Answer is:
B
Promotional Banner

Topper's Solved these Questions

  • PROBLEM SOLVING AND DATA ANALYSIS

    ENGLISH SAT|Exercise Multiple Choice|128 Videos
  • PROBLEM SOLVING AND DATA ANALYSIS

    ENGLISH SAT|Exercise Grib-In|40 Videos
  • PROBLEM SOLVING AND DATA ANALYSIS

    ENGLISH SAT|Exercise EXERICSE|80 Videos
  • PROBLEMS IN CONTEXT

    ENGLISH SAT|Exercise PRACTICE TEST|10 Videos

Similar Questions

Explore conceptually related problems

The graph above shows how the size of a country's population has changed over time. Which of the following are the most likely underlying reasons for the type of graph shown?

The figure above shows the graph of the linear function, y=f(x) . If slope of the line is -2 and f(3)=4, what is the value of b?

The graph above shows the function y=f(x) over the interval 0lexle7 . What is the value of f(f(6)) ?

Michael swam 2,000 yards on each of eighteen days. The scatterplot above shows his swim time for and corresponding heart rate after each swim. The line of best fit for the data is also shown. For the swim that took 34 minutes, Michael’s actual heart rate was about how many beats per minute less than the rate predicted by the line of best fit?

What is the average yearly increase in value of the stock?

The use of calculator is not permited. In the graph above ,a number of points are shown, and the line of best fit is also shown. What is the sum of the expected values of the Y coordinates of the points having X values 7 and 9?

Between 1985 and 2003, data were collected every three years on the amount of plastic produced annually in the United States, in billions of pounds. The graph below shows the data and a line of best fit. The equation of the line of best fit is y = 3.39x + 46.89, where x is the number of years since 1985 and y is the amount of plastic produced annually, in billions of pounds. Which of the following is closest to the percent increase in the billions of pounds of plastic produced in the United States from 2000 to 2003?

what is the greatest difference between the actual value of the stock and the value of the stock predicted by the line of best fit?

The scatterplot above shows the profit, by month, for a new company for the first year of operation. A line of best fit is also shown. Using this line, by what dollar amount did the profit in the 8th month exceed the profit in the 13th month?

ENGLISH SAT-PROBLEM SOLVING AND DATA ANALYSIS-Grib-In
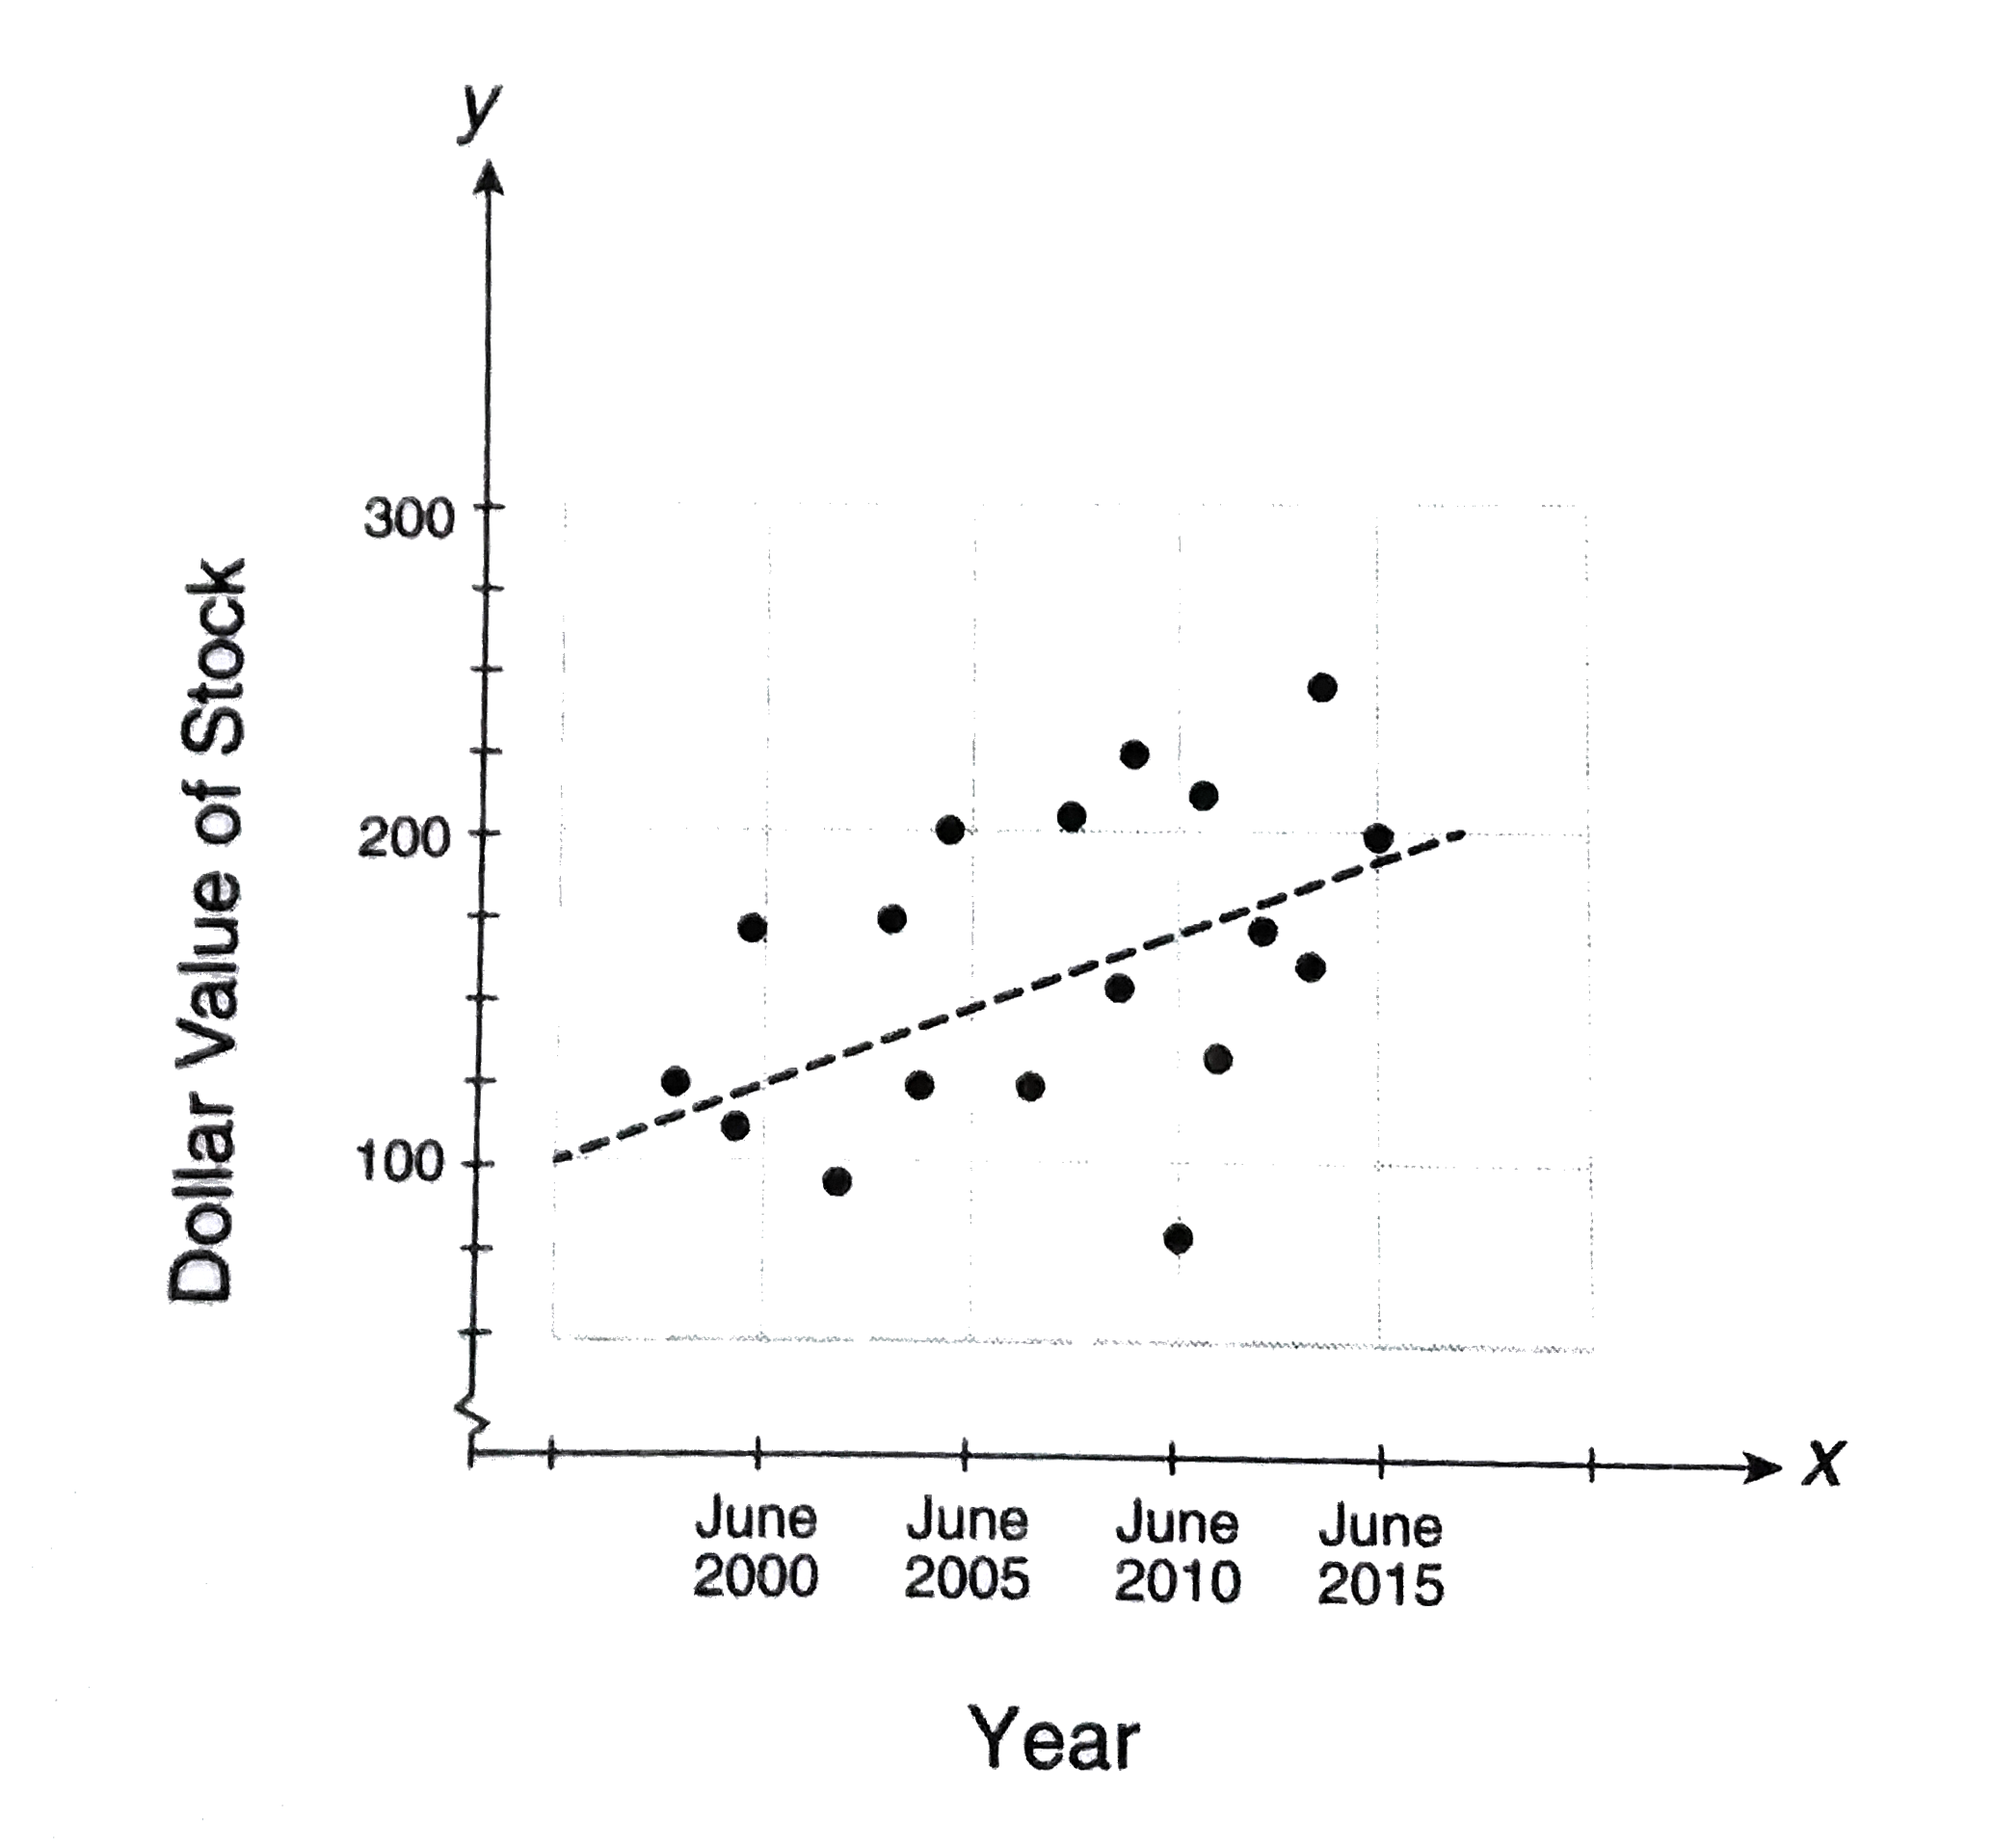
  1. The graph above shows how the value of a stock has increased over time...

    Text Solution

    |

  2. A store offers a 4% discount if a consumer pays cash rather than payin...

    Text Solution

    |

  3. During course registration, 28 students enroll in a certain college cl...

    Text Solution

    |

  4. A high school tennis team is scheduled to play 28 matches. If the team...

    Text Solution

    |

  5. In a club of 35 boys and 28 girls, 80% of the boys and 25% of the girl...

    Text Solution

    |

  6. A string is cut into 2 pieces that have lengths in the ratio of 2:9. I...

    Text Solution

    |

  7. For integer values of a and b, b^(a)=8. The ratio of a to b is equival...

    Text Solution

    |

  8. Jars A, B, and C each contains 8 marbles. What is the minimum number o...

    Text Solution

    |

  9. A political campaign organizer has determined that the number of hours...

    Text Solution

    |

  10. A square dartboard is placed in the first quadrant from x=0 to 6 and y...

    Text Solution

    |

  11. Fruit for a dessert costs $1.20 a pound. If 5 pounds of fruit are need...

    Text Solution

    |

  12. A printing press produces 4,600 flyers per hour. At this rate, in how ...

    Text Solution

    |

  13. FOREIGN CURRENCY CONVERSIONS U.S. Dollar to British Pound =1.56 to...

    Text Solution

    |

  14. Joseph typed a 1,200-word essay in 25 minutes with an average of 240 w...

    Text Solution

    |

  15. At a party, six 1-liter bottles of soda are completely emptied into 8-...

    Text Solution

    |

  16. On a certain map, 1 inch represents 2 kilometers. A region is located...

    Text Solution

    |

  17. the distance from Earth to Mars is 136,000,000 miles. A spacecraft tra...

    Text Solution

    |

  18. A certain generator will run for 1.5 miles on one liter of gas. If the...

    Text Solution

    |

  19. One knot is one nautical mile per hour, and one nautical mil is 6,080 ...

    Text Solution

    |

  20. Jacod begins painting at 12:00 noon. At 12:30 P.M. he estimate that 13...

    Text Solution

    |

  21. The number of hours, H, needed to manufacture X computer monitors is g...

    Text Solution

    |