Home
Class 12
MATHS
The graph above represents a jogger's sp...


The graph above represents a jogger's speed during her 20-minutes jog around her neighbourhood. Which statement best describes what the jogger was doing during the 9-12 minutes interval of her jog?

A

She was standing still

B

She was increasing her speed

C

She was decreasing her speed

D

She was jogging at a constant rate.

Text Solution

Verified by Experts

The correct Answer is:
D
Promotional Banner

Topper's Solved these Questions

  • PROBLEM SOLVING AND DATA ANALYSIS

    ENGLISH SAT|Exercise Grib-In|40 Videos
  • PROBLEM SOLVING AND DATA ANALYSIS

    ENGLISH SAT|Exercise Grib-In|40 Videos
  • PROBLEM SOLVING AND DATA ANALYSIS

    ENGLISH SAT|Exercise EXERICSE|80 Videos
  • PROBLEMS IN CONTEXT

    ENGLISH SAT|Exercise PRACTICE TEST|10 Videos

Similar Questions

Explore conceptually related problems

The graph above shows the average daily temperature during a particular week in January in certain city. Which statement best describes the temperature date in the graph above?

Question 13 and 14 refer to the gaph above which shows the heart rate, in veats per minutes, of a jogger during a 4-minutes interval. Q. The greatest percent of increase in the jogger's heart rate occured over what interval of time, in minutes?

Question 13 and 14 refer to the gaph above which shows the heart rate, in veats per minutes, of a jogger during a 4-minutes interval. Q. Overr what interval of time, in minutes, was the jogger's heart rate changing at a constant rate?

Shalu cycles to her school at an average speed of 12 km/hr. It takes her 20 minutes to reach the school. If she wants to reach her school in 15 minutes, what should be her average speed?

When amy exercise in her fitness certer for 1 hour she burns a total of 475 calories. If she burns 9 calories a minute jogging on the treadmilll and then burns 6.5 calories a minute pedalling on the stationary bicycle, how many minutes of the hour does she spend exercising on the bicycle?

In an experiment, a heated cup of coffee is removed from a heat source, and the cup of coffee is then left in a room that is kept at a constant temperature. The graph above shows the temperature, in degrees Fahrenheit (.^@F) , of the coffee immediately after being removed from the heat source and at 10-minute intervals thereafter. During which of the following 10-minute intervals does the temperature of the coffee decrease at the greatest average rate?

ENGLISH SAT-PROBLEM SOLVING AND DATA ANALYSIS-Multiple Choice
  1. The yearly growth in the number of fast food restaurants by the functi...

    Text Solution

    |

  2. C=60+0.05d The equation above represents the total monthly cost, C, ...

    Text Solution

    |

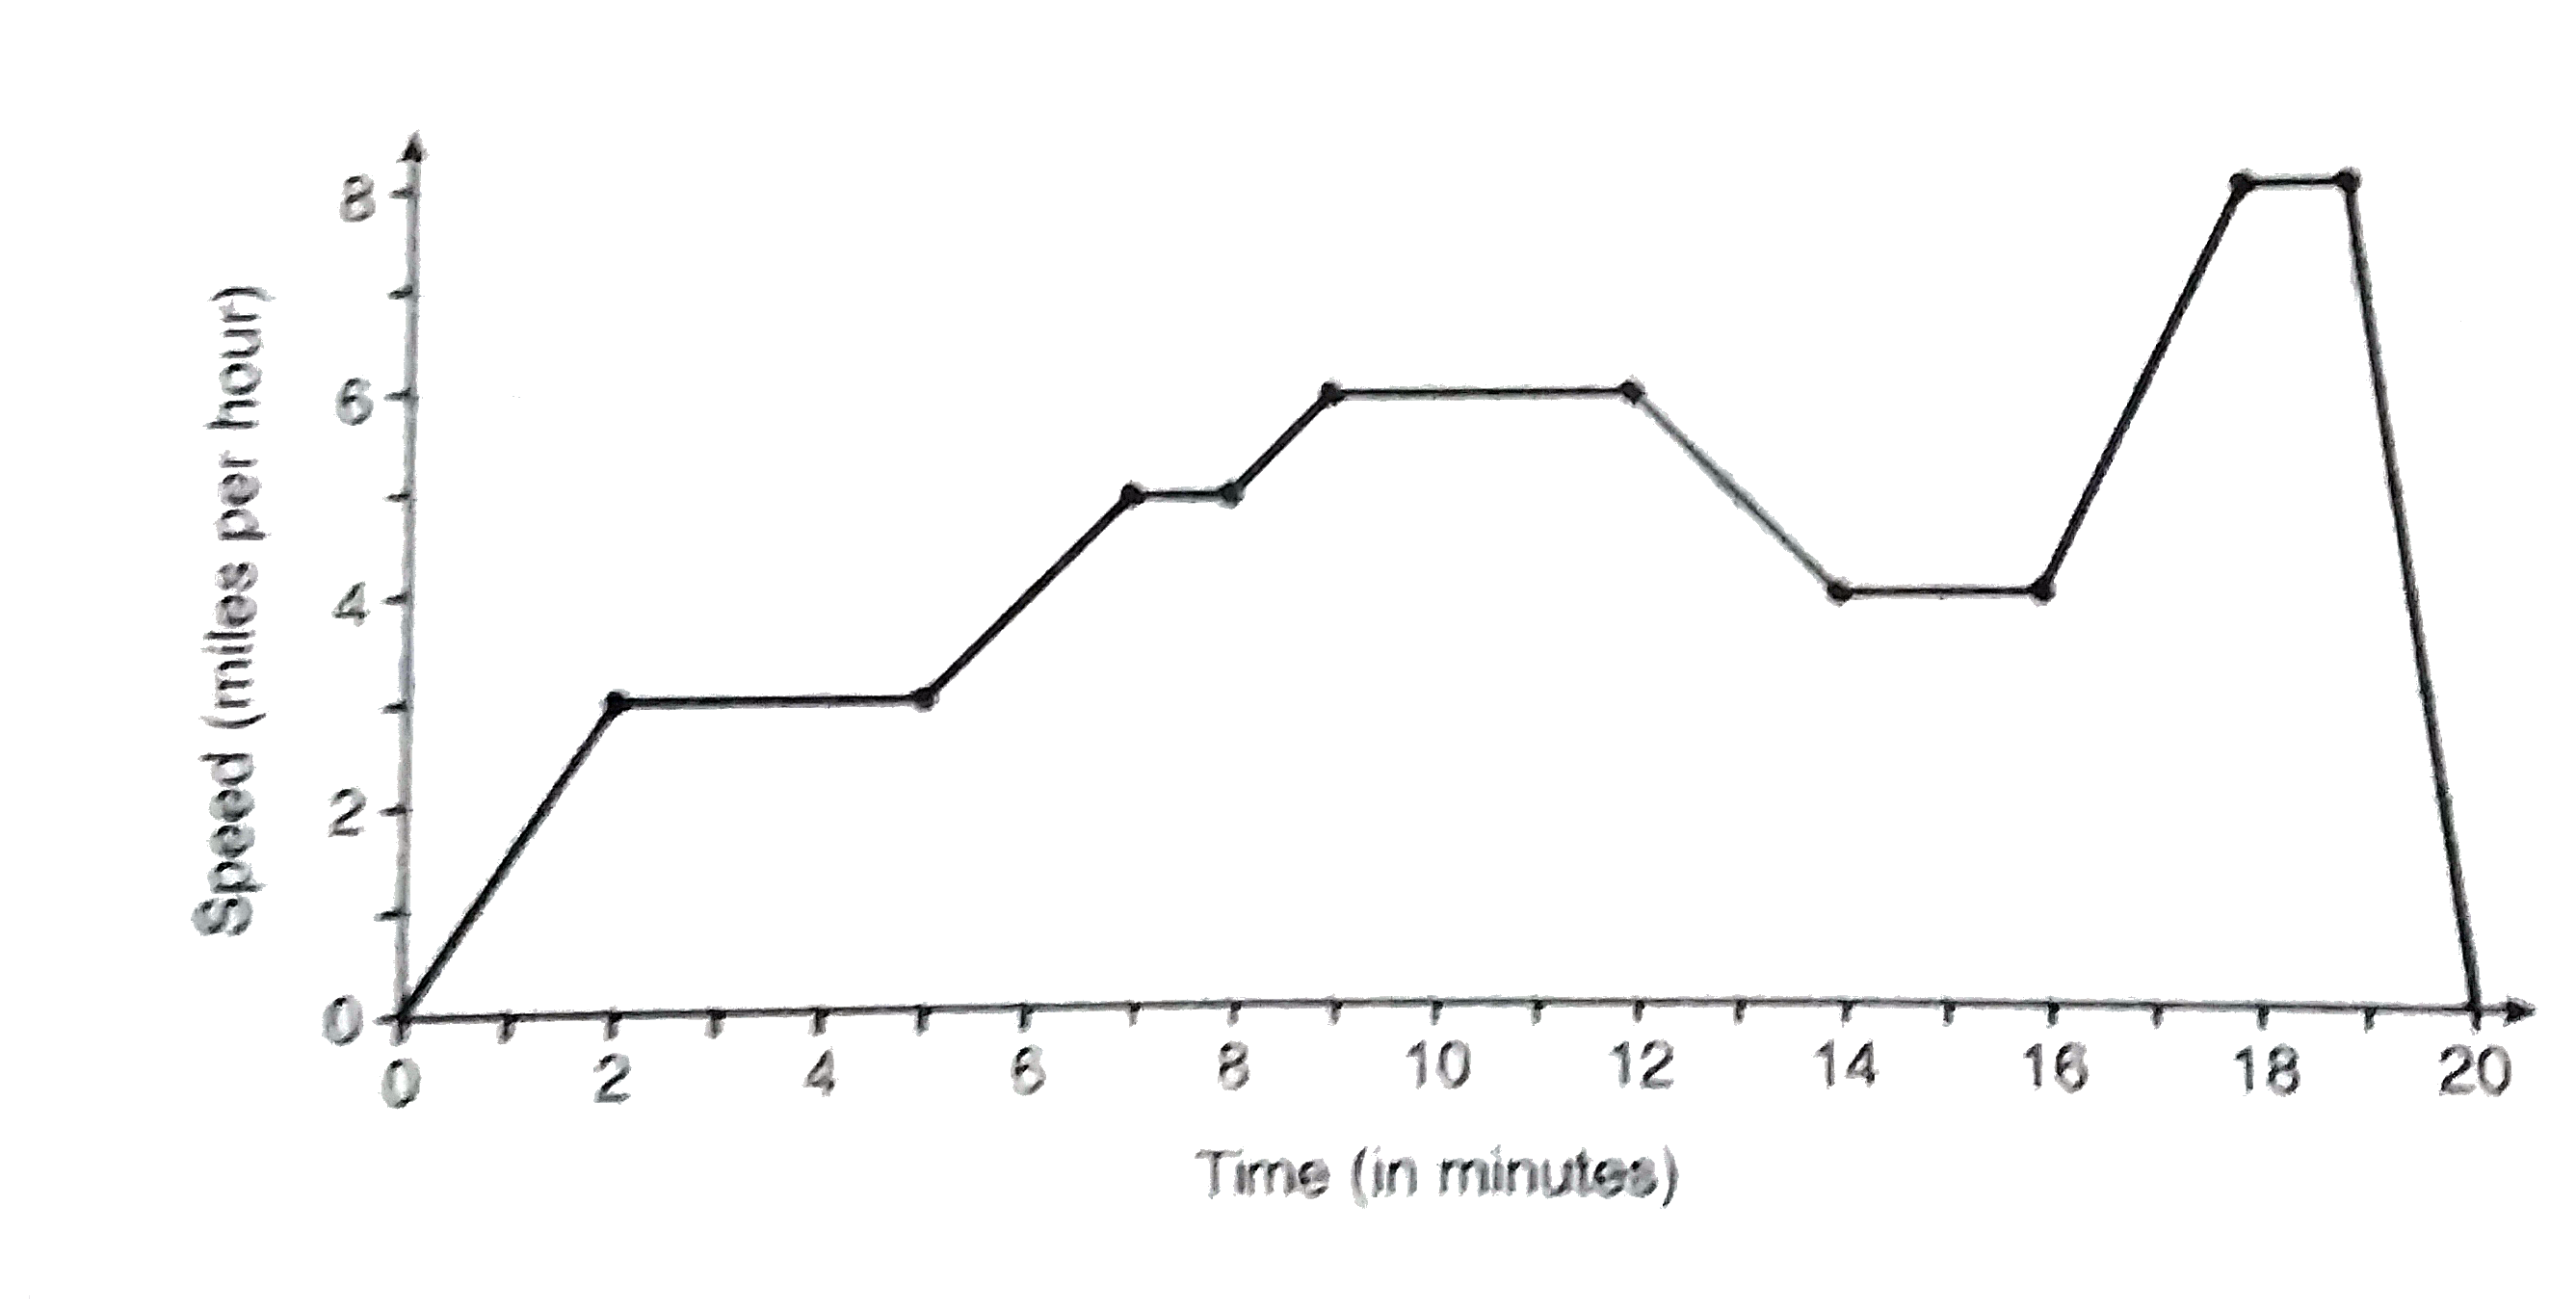
  3. The graph above represents a jogger's speed during her 20-minutes jog ...

    Text Solution

    |

  4. If a(n) represents the nth term of the sequence 45, 18, 6, …, and a(1)...

    Text Solution

    |

  5. The owner of a small computer repair business has one employee, who is...

    Text Solution

    |

  6. The breakdown of a sample of a chemical compounds is represented by th...

    Text Solution

    |

  7. Some banks chargea fee on saving accounts that are left inactive for a...

    Text Solution

    |

  8. Chris plans to purchase a car that loses it value at rate of 14% per y...

    Text Solution

    |

  9. Vanessa plans to invest $10,000 for 5 years at an annual intersect rat...

    Text Solution

    |

  10. Miriam and Jessica are growing bacteria in a laboratory. Miriam uses t...

    Text Solution

    |

  11. The number of square units, A, in the area covered by a bacteria cultu...

    Text Solution

    |

  12. Two health clubs offer different membership plans. The accompanying gr...

    Text Solution

    |

  13. Based on the data in the table above, which statements is true about t...

    Text Solution

    |

  14. The City Tunnel and Bridge Authority in a certain city estimates that ...

    Text Solution

    |

  15. Which of the accomanying tables that show how population is changing o...

    Text Solution

    |

  16. A radioactive substance has an initial mass of 100 grams, and its mass...

    Text Solution

    |

  17. The gas tank in a car holds a total of 16 gallons of gas. The car trav...

    Text Solution

    |

  18. Q. If there are 72 SAT Math scores between 510 and 600, how many SAT M...

    Text Solution

    |

  19. Q. If 20% of the students with SAT Math scores from 610 to 700 receive...

    Text Solution

    |

  20. Q. The table shows the minimum age requirement for obtaining a driver...

    Text Solution

    |