Home
Class 12
MATHS
Q. If there are 72 SAT Math scores betwe...


Q. If there are 72 SAT Math scores between 510 and 600, how many SAT Math scores are above 700?

A

`40`

B

`48`

C

`56`

D

`76`

Text Solution

Verified by Experts

The correct Answer is:
B
Promotional Banner

Topper's Solved these Questions

  • PROBLEM SOLVING AND DATA ANALYSIS

    ENGLISH SAT|Exercise Grib-In|40 Videos
  • PROBLEM SOLVING AND DATA ANALYSIS

    ENGLISH SAT|Exercise Grib-In|40 Videos
  • PROBLEM SOLVING AND DATA ANALYSIS

    ENGLISH SAT|Exercise EXERICSE|80 Videos
  • PROBLEMS IN CONTEXT

    ENGLISH SAT|Exercise PRACTICE TEST|10 Videos

Similar Questions

Explore conceptually related problems

On a test that has a normal distribution of scores of 59 falls two standard deviations below the mean, and score of 74 is one standard deviation above the mean. If x is an integer score that lies between 2.5 and 3.0 standard deviations above the means. What is a possible value of x?

Q. If 20% of the students with SAT Math scores from 610 to 700 received collage scholarships, how many students with SAT Math scores from 610 to 700 received collage scholarships?

The bar graph above shows the verbal and math SAT scores for five students labeled A through E. If a scatterplot of the data in the bar graph is made such that the math SAT score for each student is plotted along the x-axis and their verbal SAT score is plotted along the y-axis, how many of the data points would lie above the line y=x?

A collage math professor informs her students that rather than curving final grades, she will replace each student's lowest test score with the next ot lowest test score, and then re-average the rest grades. If Leeza has test scores of 86, 92, 81, 64, and 83, by how many points does her final test average change based on the professor's policy?

The final marks in mathematics of 30 students are as follows: 53,61,48,60,78,68,55,100,67,90,75,88,77,37,84 58,60,48,62,56,44,58,52,64,98,59,70,39,50,60 Arrange these marks in the ascending order, 30 to 39 one group, 40 to 49 second group etc. Now answer the following: What is the highest score? What is the lowest score? What is the range? If 40 is the pass marks how many have failed? How many have scored 75 or more? Which observations between 50 and 60 have not actually appeared? How many have scored less than 50?

After 9 games, the mean number of goals scored by a football team is 3.If after one more game the new mean value of goals scored is 2.9, how many goals did they score in this game?

In the figure, MATH is a rectangle, GB=4.8, MH=6, and HT=15. The area of the shaded region is how many times larger than the area of triangleMBA ?

In a series of tests, A appeared for 8 tests Each test was marked out of 30 and averages 25. However, while checking his files, A could only find 7 of the 8 tests. For these he scored 29 26, 18 ,20, 27, 24 and 29. Determine how many marks he scored for the eighth test.

A wave of frequency 500 HZ travels between X and Y, a distance of 600 m in 2 sec. How many wavelength are there in distance XY :-

ENGLISH SAT-PROBLEM SOLVING AND DATA ANALYSIS-Multiple Choice
  1. A radioactive substance has an initial mass of 100 grams, and its mass...

    Text Solution

    |

  2. The gas tank in a car holds a total of 16 gallons of gas. The car trav...

    Text Solution

    |

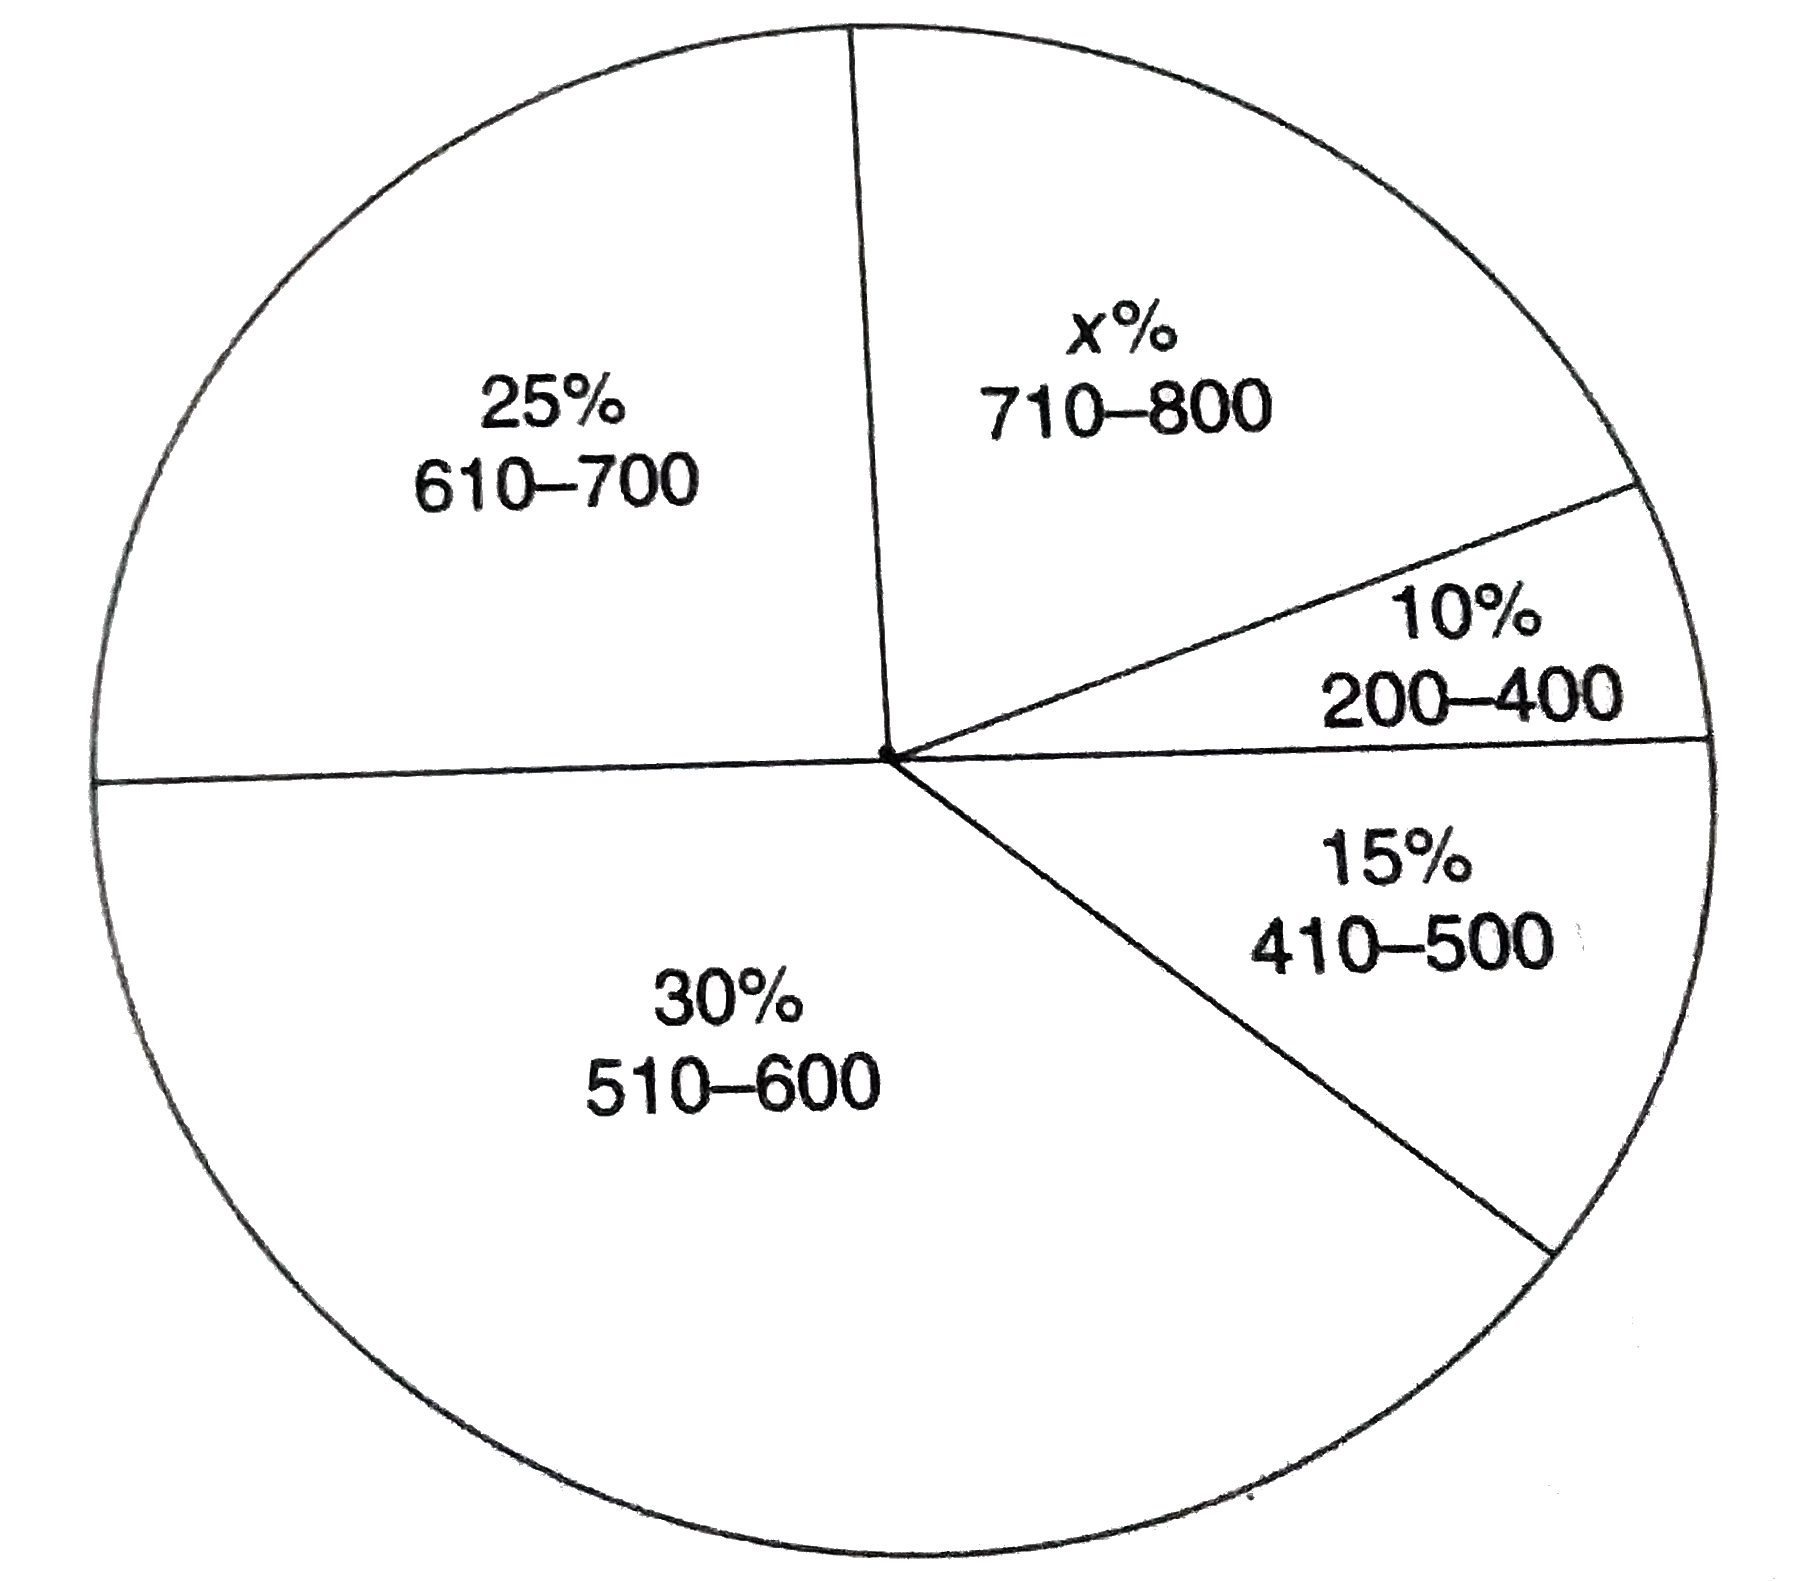
  3. Q. If there are 72 SAT Math scores between 510 and 600, how many SAT M...

    Text Solution

    |

  4. Q. If 20% of the students with SAT Math scores from 610 to 700 receive...

    Text Solution

    |

  5. Q. The table shows the minimum age requirement for obtaining a driver...

    Text Solution

    |

  6. Q. If a state is chosen at random, what is the probability that the mi...

    Text Solution

    |

  7. The graph above shows the number of U.S. households with laptop comput...

    Text Solution

    |

  8. The graph above shows the number of U.S. households with laptop comput...

    Text Solution

    |

  9. The graph above graphs how $250,000 is invested. Q. How much money ...

    Text Solution

    |

  10. The graph above graphs how $250,000 is invested. Q. After 20% of the...

    Text Solution

    |

  11. Q. The percent increase in the number of students enrolled in advanced...

    Text Solution

    |

  12. Q. From 2014 to 2015 the number of students enrolled in advanced mathe...

    Text Solution

    |

  13. Q. In 2012, the number of cars purchased was x percent of the number o...

    Text Solution

    |

  14. Question 11 and 12 refer to the gaph above. Q. Which of the followin...

    Text Solution

    |

  15. Question 13 and 14 refer to the gaph above which shows the heart rate,...

    Text Solution

    |

  16. Question 13 and 14 refer to the gaph above which shows the heart rate,...

    Text Solution

    |

  17. The table above can be used to approximate the circumference of the he...

    Text Solution

    |

  18. The cumulative histrogram above shows the distribution of scores that ...

    Text Solution

    |

  19. The table above shows the composition of a coed high school tennis tea...

    Text Solution

    |

  20. Which survey is most likely to have the least bais?

    Text Solution

    |