Home
Class 12
MATHS
The table above summarizes the number of...


The table above summarizes the number of people by age group who were included in a survey of driving habits. Which of the following statements is true?

A

The survey was not biased since different age groups were included.

B

The survey was biased becouse individuals 36 and older were underrespresented.

C

The survey was biased because it did not differentiate between males and females

D

The survey was not biased since a large number of drivers were polled.

Text Solution

Verified by Experts

The correct Answer is:
B
Promotional Banner

Topper's Solved these Questions

  • PROBLEM SOLVING AND DATA ANALYSIS

    ENGLISH SAT|Exercise Grib-In|40 Videos
  • PROBLEM SOLVING AND DATA ANALYSIS

    ENGLISH SAT|Exercise Grib-In|40 Videos
  • PROBLEM SOLVING AND DATA ANALYSIS

    ENGLISH SAT|Exercise EXERICSE|80 Videos
  • PROBLEMS IN CONTEXT

    ENGLISH SAT|Exercise PRACTICE TEST|10 Videos

Similar Questions

Explore conceptually related problems

If a and b are two different positive real numbers then which of the following statement is true?

Which of the following statements are true for group 2 elements?

For the percipitation reaction of Ag^(o+) ions with NaCI , which of the following statements is true?

For the percipitation reaction of Ag^(o+) ions with NaCI , which of the following statements is true?

The graph of g(x) is shown in the figure above. If h(x)=-g(x)+1 , which of the following statements is true?

Astatine is the element below iodine in the group VIIA of the periodic table. Which of the following statements is not true for astatine?

A cube of a metal is given a positive charge Q . For the above system, which of the following statements is true ?

The table above shows the distribution of the number of push ups completed by 30 people in a high school gym class. Which of the following is true the mean, mode, and the range of the numbers of push ups completed?

Which of the following statement is not true about carbonyl group :

A survey was conducted among a randomly chosen sample of 250 single men and 250 single women about whether they owned any dogs or cats. The table below displays a summary of the survey results. According to the table, which of the following statements is true?

ENGLISH SAT-PROBLEM SOLVING AND DATA ANALYSIS-Multiple Choice
  1. Which survey is most likely to have the least bais?

    Text Solution

    |

  2. Erica is conducting a survey about the proposed increase in the sports...

    Text Solution

    |

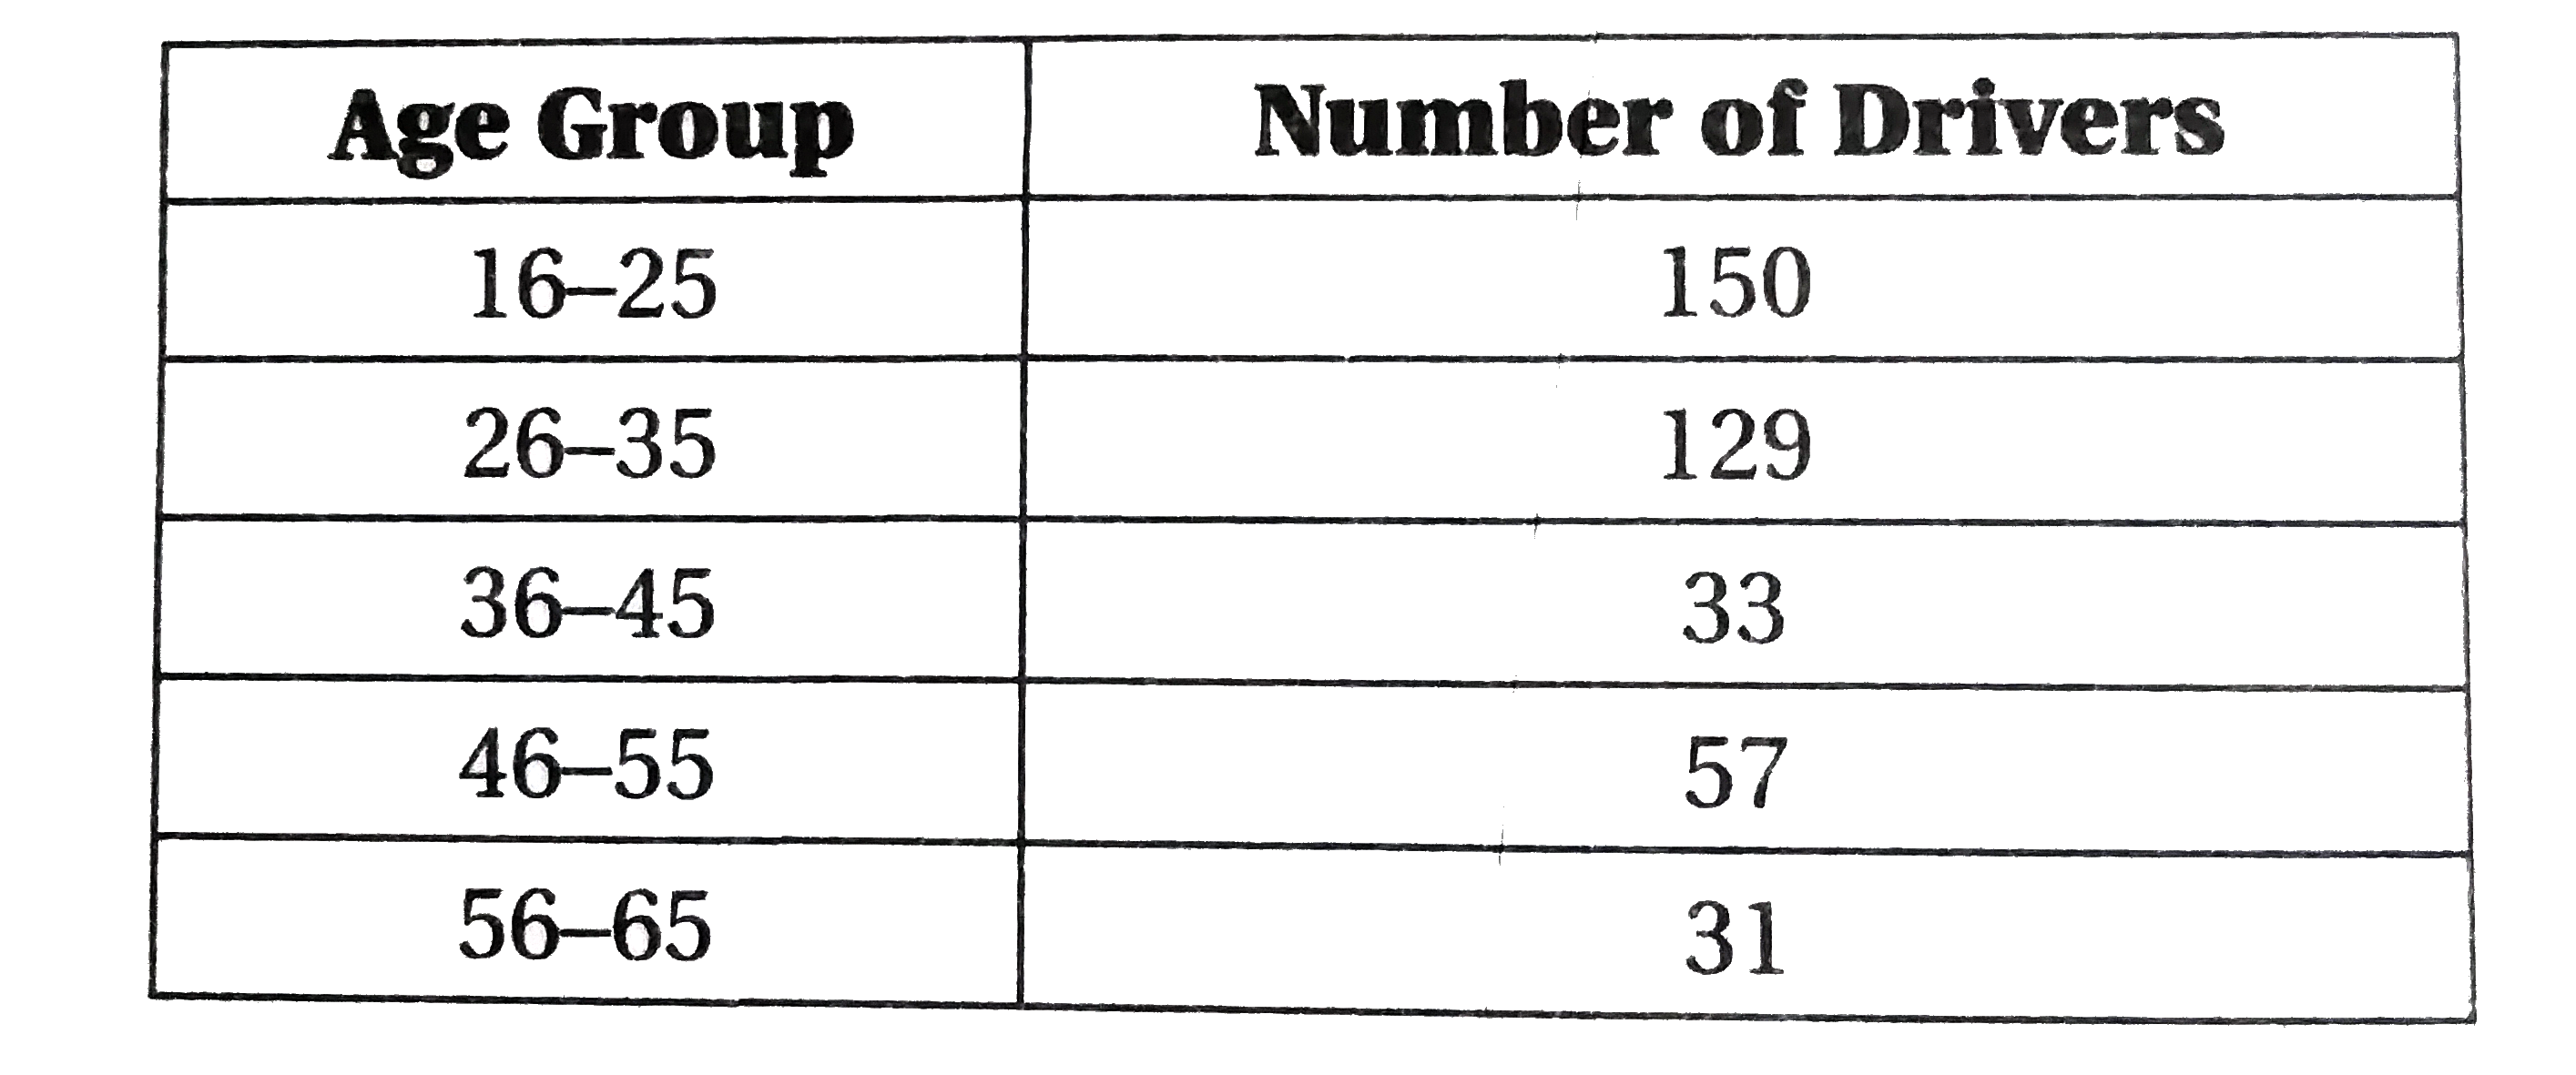
  3. The table above summarizes the number of people by age group who were ...

    Text Solution

    |

  4. The scatterplot above shows the profit, by month, for a new company fo...

    Text Solution

    |

  5. A new fitness class was started at several fitness clubs owned by the ...

    Text Solution

    |

  6. A new fitness class was started at several fitness clubs owned by the ...

    Text Solution

    |

  7. Question 5-7 refer to the scatterplot above. A new fitness class was...

    Text Solution

    |

  8. The bar graph above shows the verbal and math SAT scores for five stud...

    Text Solution

    |

  9. The average (arithemetic mean) of a set of seven numbers is 81. If one...

    Text Solution

    |

  10. the arithmetic mean of a set of 20 test scores is represented by x. If...

    Text Solution

    |

  11. What is the area of the circle whose radius is the average of the radi...

    Text Solution

    |

  12. The diagram above shows a graph of the student's test scores in Ms. We...

    Text Solution

    |

  13. If k is a positive integer, which of the following represents the aver...

    Text Solution

    |

  14. When x is subtracted from 2y, the difference is equal to the average o...

    Text Solution

    |

  15. If the average of x, y, and z is 32 and the average of y and z is 27. ...

    Text Solution

    |

  16. Which of the following statements is true about the data in the tables...

    Text Solution

    |

  17. A man drove a car at an average rate of speed of 45 miles per hour fo...

    Text Solution

    |

  18. In a set of n date values, m represents the median. If each number in ...

    Text Solution

    |

  19. Susan received grades of 78, 93, 82, and 76 on four math exams. What i...

    Text Solution

    |

  20. What is the average of (x+y)^(2) and (x-y)^(2)?

    Text Solution

    |