Home
Class 12
MATHS
The graph above shows the average daily ...


The graph above shows the average daily temperature during a particular week in January in certain city. Which statement best describes the temperature date in the graph above?

A

Median=mean

B

meas`lt` mode

C

median =mode

D

mean=mode

Text Solution

Verified by Experts

The correct Answer is:
C
Promotional Banner

Topper's Solved these Questions

  • PROBLEM SOLVING AND DATA ANALYSIS

    ENGLISH SAT|Exercise Grib-In|40 Videos
  • PROBLEM SOLVING AND DATA ANALYSIS

    ENGLISH SAT|Exercise Grib-In|40 Videos
  • PROBLEM SOLVING AND DATA ANALYSIS

    ENGLISH SAT|Exercise EXERICSE|80 Videos
  • PROBLEMS IN CONTEXT

    ENGLISH SAT|Exercise PRACTICE TEST|10 Videos

Similar Questions

Explore conceptually related problems

The graph above represents a jogger's speed during her 20-minutes jog around her neighbourhood. Which statement best describes what the jogger was doing during the 9-12 minutes interval of her jog?

The inequality |1.5C-24|le30 represents the range of monthly average temperature, C, in degrees Celsius, during the winter month for a certain city. What was the lowest monthly average temperature, in degrees Celsius, for for this city?

The graph in the figure shows how the displacement of a particle describing S.H.M. varies with time. Which one of the following statements is not true ?

The following graph shows the temperature forecast and the actual temperature for each day of a week.(a) On which days was the forecast temperature the same as the actual temperature? (b) What was the maximum forecast temperature during the week?(c) What was the minimum actual temperature during the week?(d) On which day did the actual temperature differ the most from the forecast temperature?

In an experiment, a heated cup of coffee is removed from a heat source, and the cup of coffee is then left in a room that is kept at a constant temperature. The graph above shows the temperature, in degrees Fahrenheit (.^@F) , of the coffee immediately after being removed from the heat source and at 10-minute intervals thereafter. During which of the following 10-minute intervals does the temperature of the coffee decrease at the greatest average rate?

As dry air moves upward , it expands and cools. If the temperature on the ground is 20^@ C and the temperature at a height of 1 km is 10^@ C, which of the following linear models best describes the temperature t in degrees C at a height of h km above the ground ?

ENGLISH SAT-PROBLEM SOLVING AND DATA ANALYSIS-Multiple Choice
  1. What is the area of the circle whose radius is the average of the radi...

    Text Solution

    |

  2. The diagram above shows a graph of the student's test scores in Ms. We...

    Text Solution

    |

  3. If k is a positive integer, which of the following represents the aver...

    Text Solution

    |

  4. When x is subtracted from 2y, the difference is equal to the average o...

    Text Solution

    |

  5. If the average of x, y, and z is 32 and the average of y and z is 27. ...

    Text Solution

    |

  6. Which of the following statements is true about the data in the tables...

    Text Solution

    |

  7. A man drove a car at an average rate of speed of 45 miles per hour fo...

    Text Solution

    |

  8. In a set of n date values, m represents the median. If each number in ...

    Text Solution

    |

  9. Susan received grades of 78, 93, 82, and 76 on four math exams. What i...

    Text Solution

    |

  10. What is the average of (x+y)^(2) and (x-y)^(2)?

    Text Solution

    |

  11. The average of the test scores of a group of x students is 76 and the ...

    Text Solution

    |

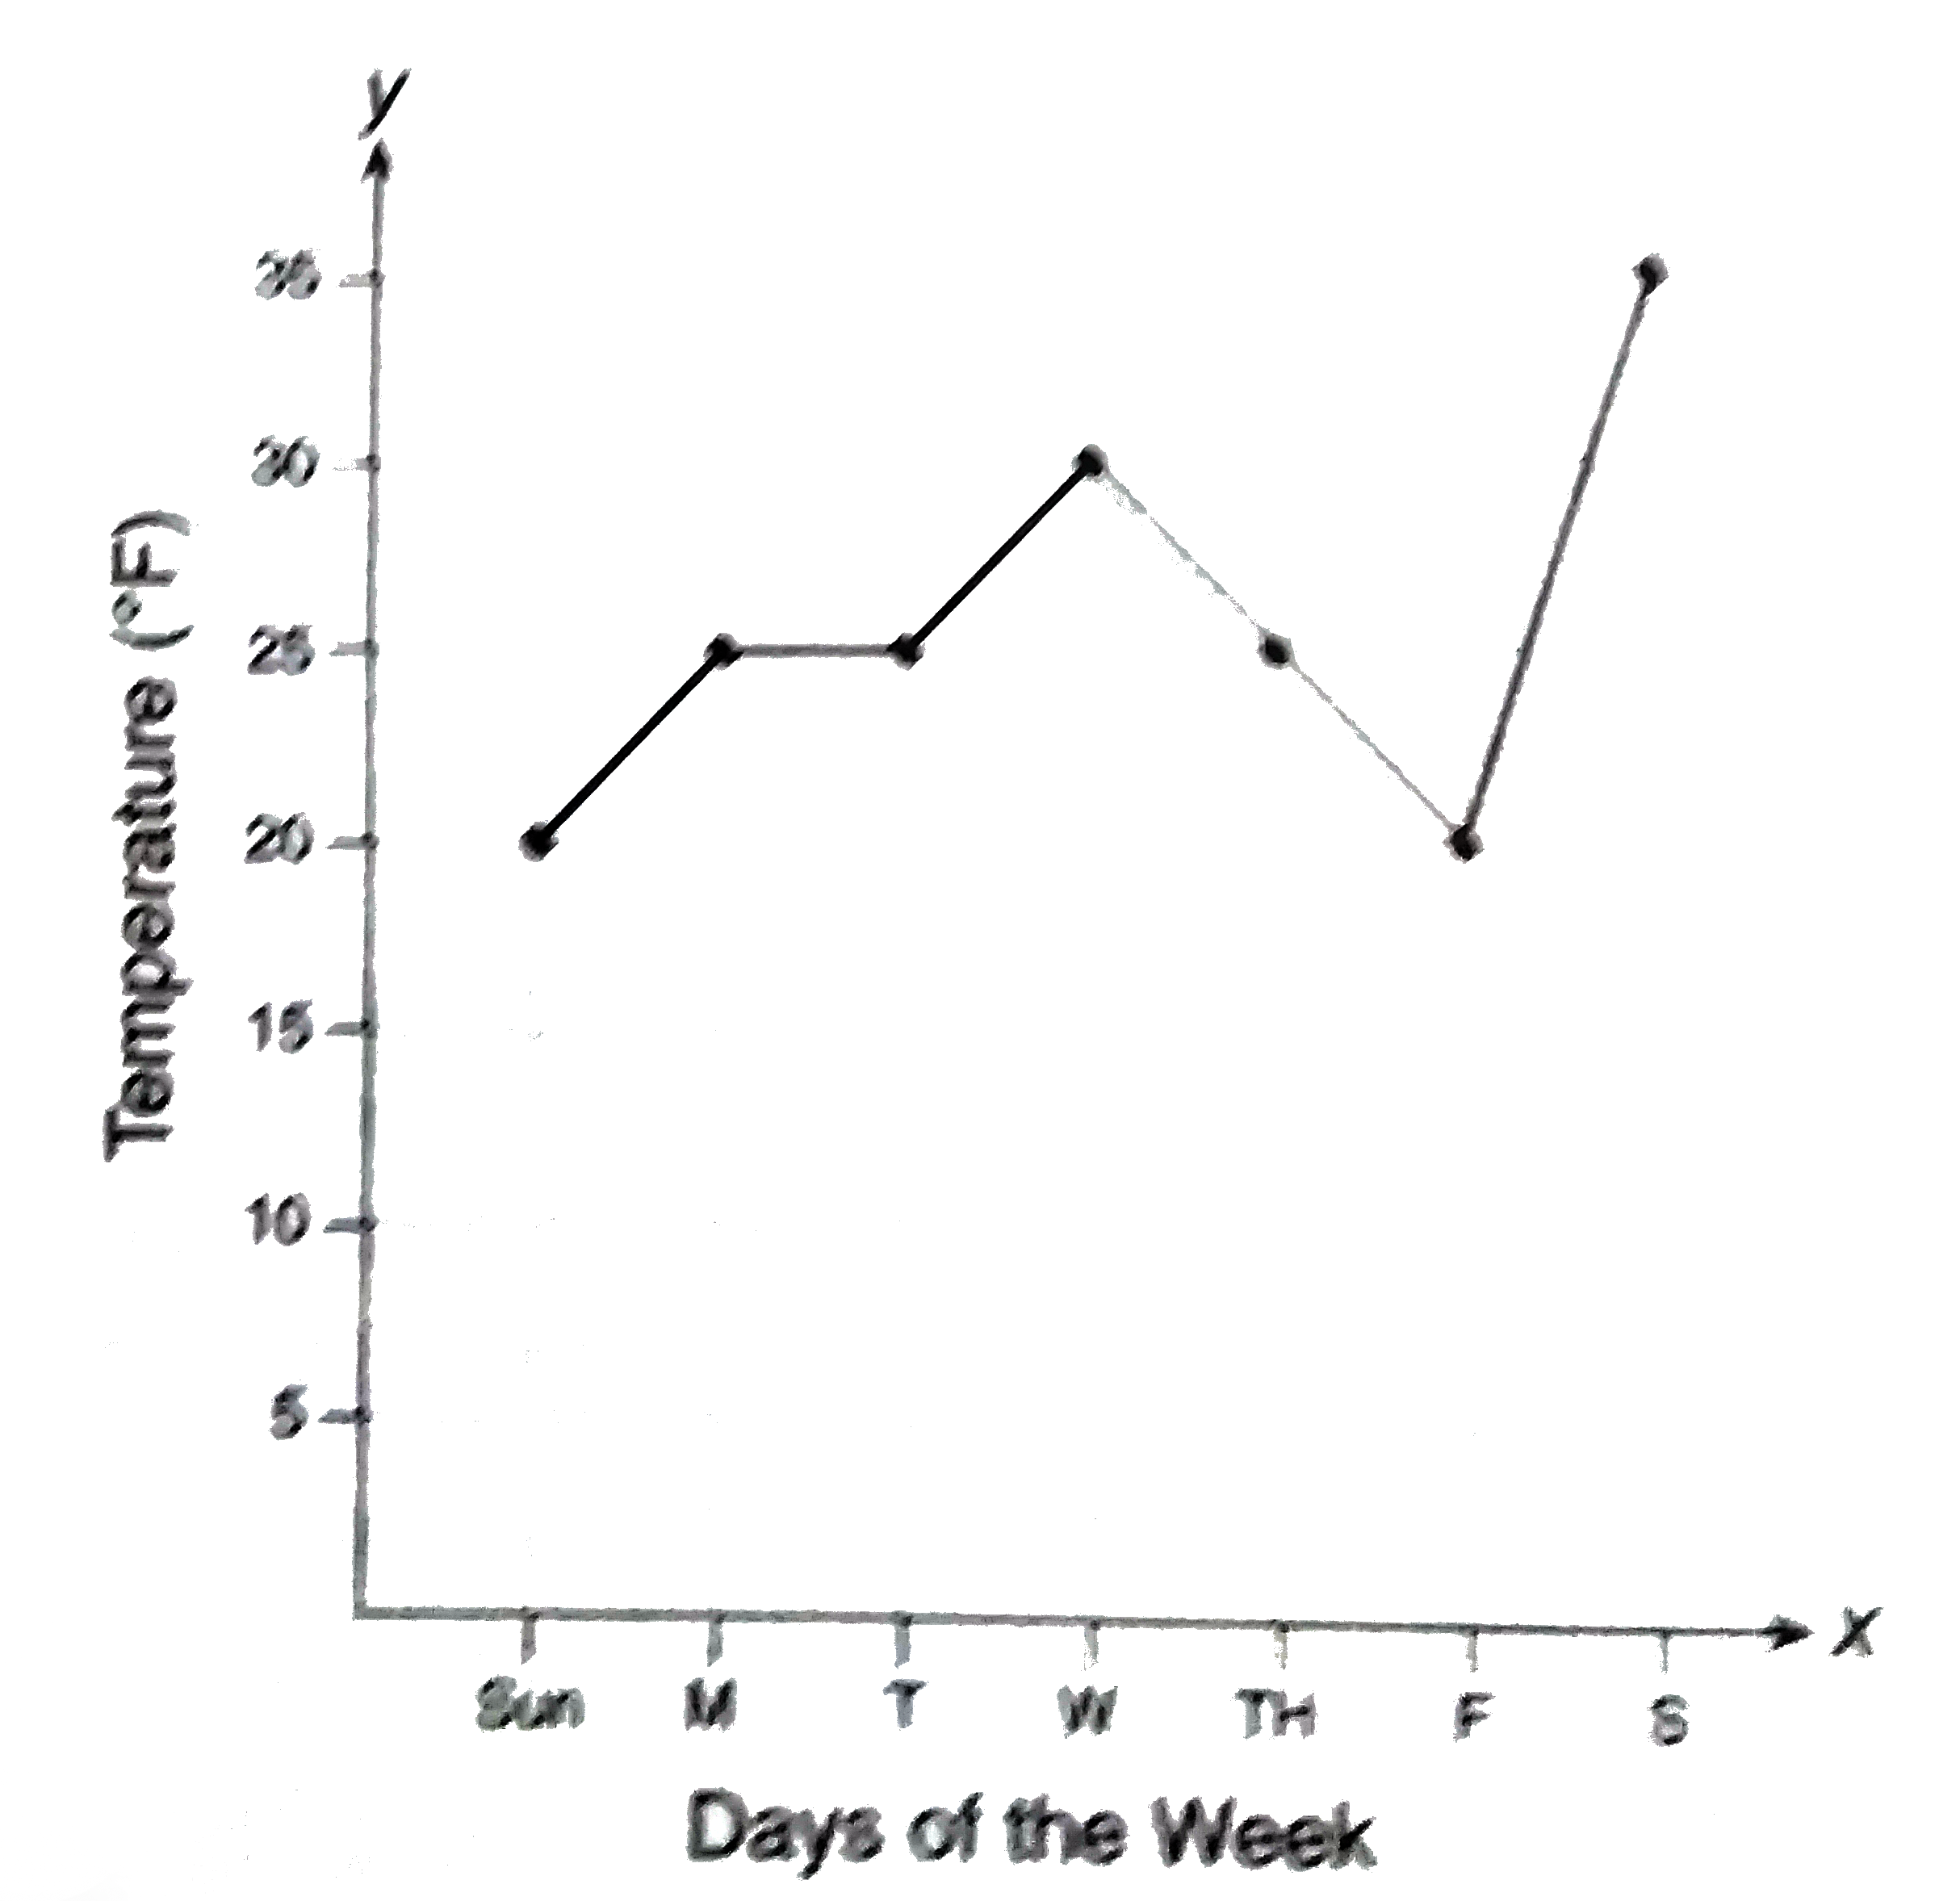
  12. The graph above shows the average daily temperature during a particula...

    Text Solution

    |

  13. The average of a, b, c, d, and e is 28. If the average of a, c, and e ...

    Text Solution

    |

  14. If 2a+b=7 and b+2c=23, what is the average of a, b, and c?

    Text Solution

    |

  15. The number of minutes students took to complete a quiz is summarized i...

    Text Solution

    |

  16. The average of a, b, c, and d is p. If the average of a and c is q, wh...

    Text Solution

    |

  17. The lowest value in a set of ordered scores is x and the highest value...

    Text Solution

    |

  18. The tables give the distribution of grades for 21 students in two diff...

    Text Solution

    |

  19. 21-22 The table above shows the annual salaries for the 24 members of ...

    Text Solution

    |

  20. 21-22 The table above shows the annual salaries for the 24 members of ...

    Text Solution

    |