Text Solution
Verified by Experts
The correct Answer is:


ENGLISH SAT-PROBLEM SOLVING AND DATA ANALYSIS-Grib-In
- Given a starting population of 100 bacteria, the formula b(t)=100(2^(t...
Text Solution
|
- A certain drug raises a patient's heart rate, h, in beats per minute...
Text Solution
|
- The breakdown of sample of chemical compound is represented by the fun...
Text Solution
|
- Sasha invested $1,200 in a savings account at an annual interest rate ...
Text Solution
|
- the graph above that summarizes a survey of a group of 250 people who ...
Text Solution
|
- Question 1 and 2 refer to the graph above that summarizes a survey of ...
Text Solution
|
- The histogram above shows the number of mobile text message sent by a ...
Text Solution
|
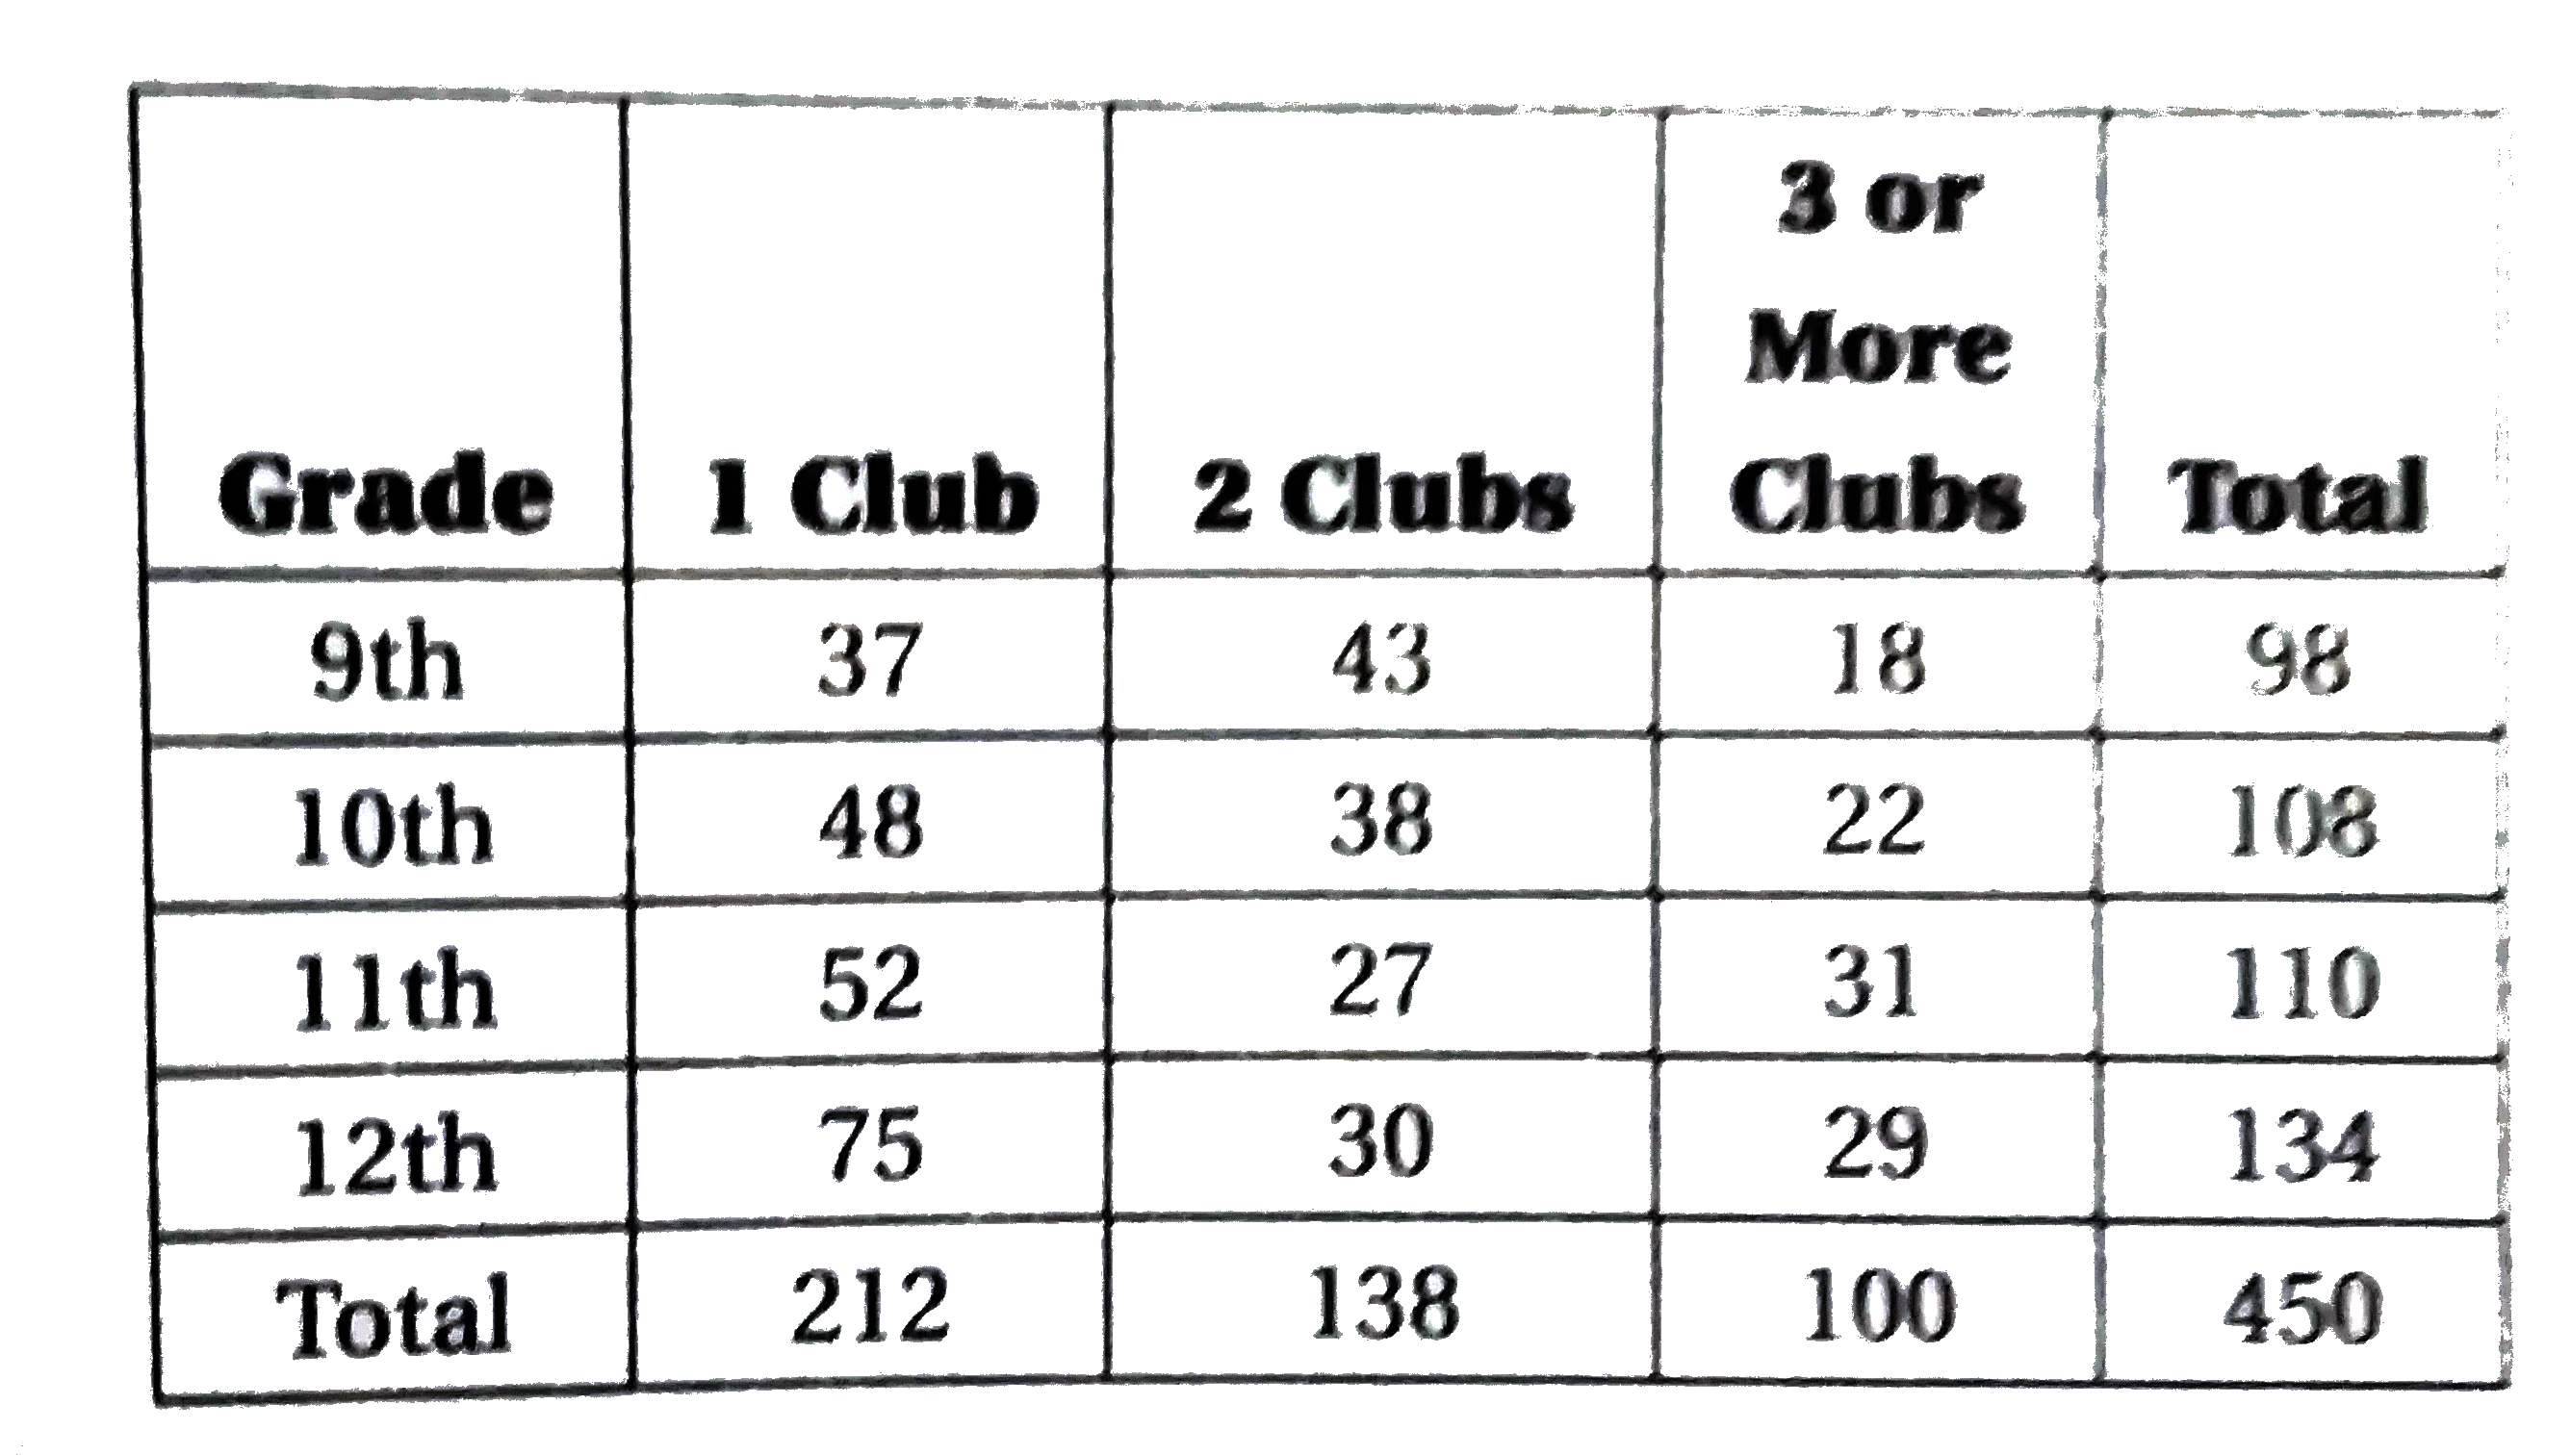
- Question 4-6 refer to the above table, which summarizes the result of ...
Text Solution
|
- Question 4-6 refer to the above table, which summarizes the result of ...
Text Solution
|
- Question 4-6 refer to the above table, which summarizes the result of ...
Text Solution
|
- The partially completed table above describes the distribution of 200 ...
Text Solution
|
- Based on the comulative histogram above, what percent of the total num...
Text Solution
|
- The cumulative histogram above shows the distribution of mistakes 28 s...
Text Solution
|
- Question 1-3 refer to the above scatterplot, which shows wrist and nec...
Text Solution
|
- Question 1-3 refer to the above scatterplot, which shows wrist and nec...
Text Solution
|
- Question 1-3 refer to the above scatterplot, which shows wrist and nec...
Text Solution
|
- The average of r and s is 7.5, and the average of r, s and t is 11. Wh...
Text Solution
|
- If the average of x, y, and z is 12, what is the average of 3x, 3y, an...
Text Solution
|
- In order to compensate for a diffecult midterm exam. Danialle's mathem...
Text Solution
|
- On a test that has normal distribution of scores, a score of 58 falls ...
Text Solution
|