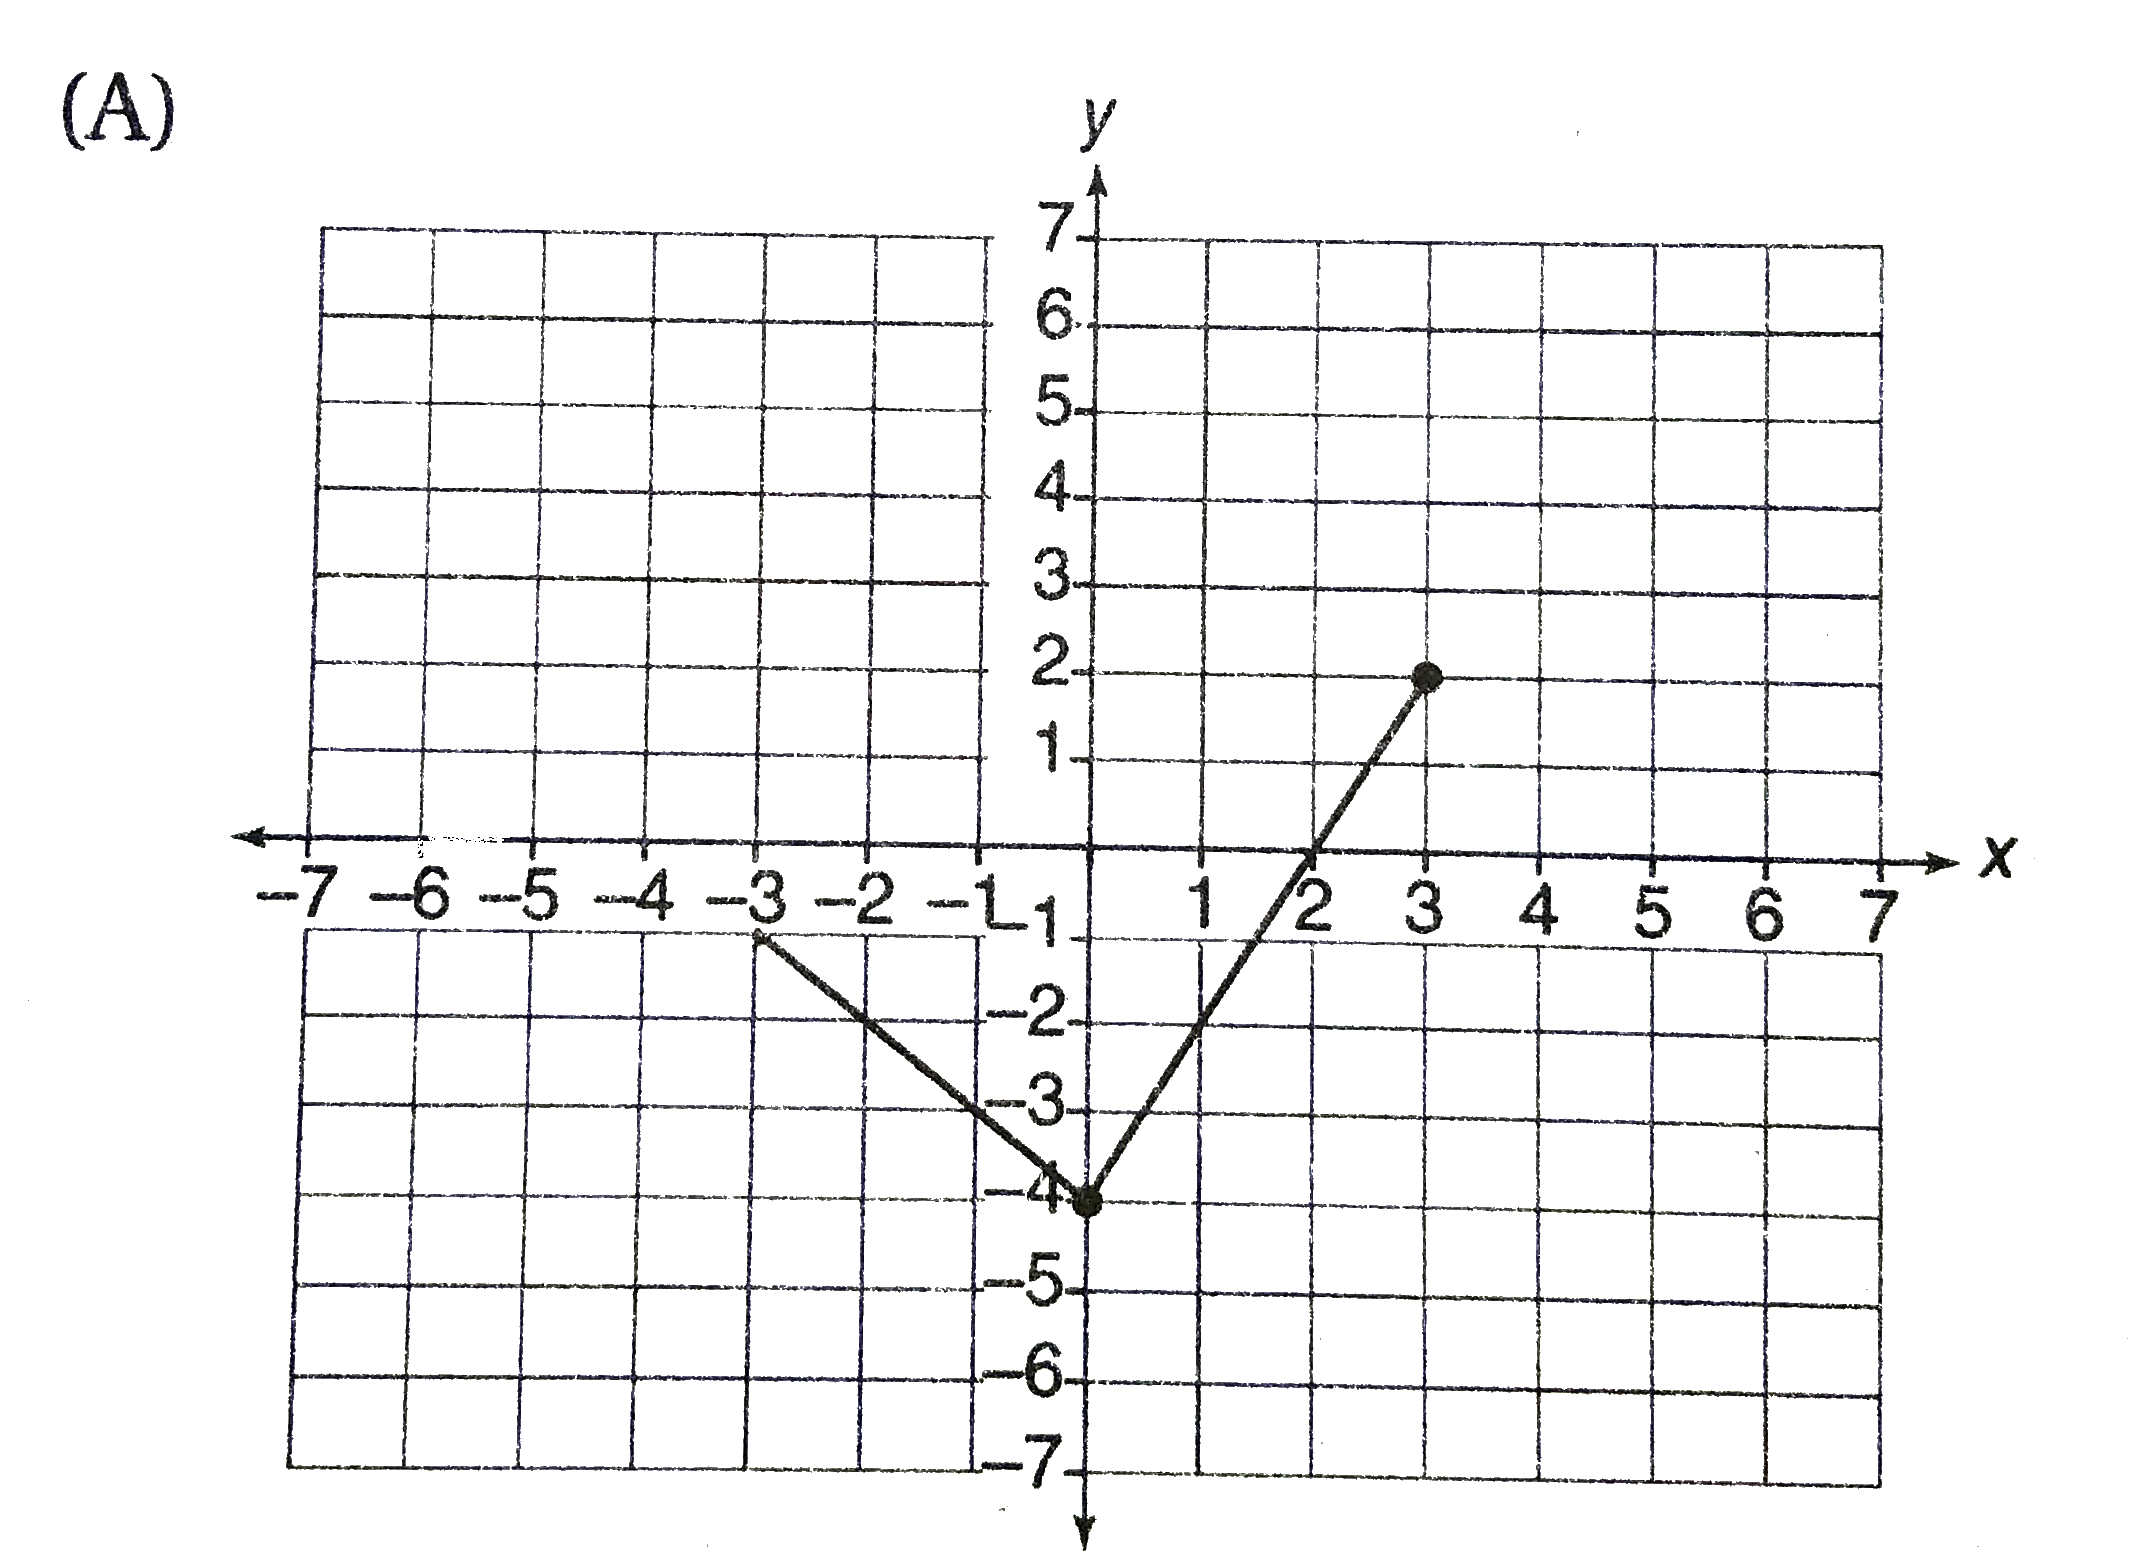
A
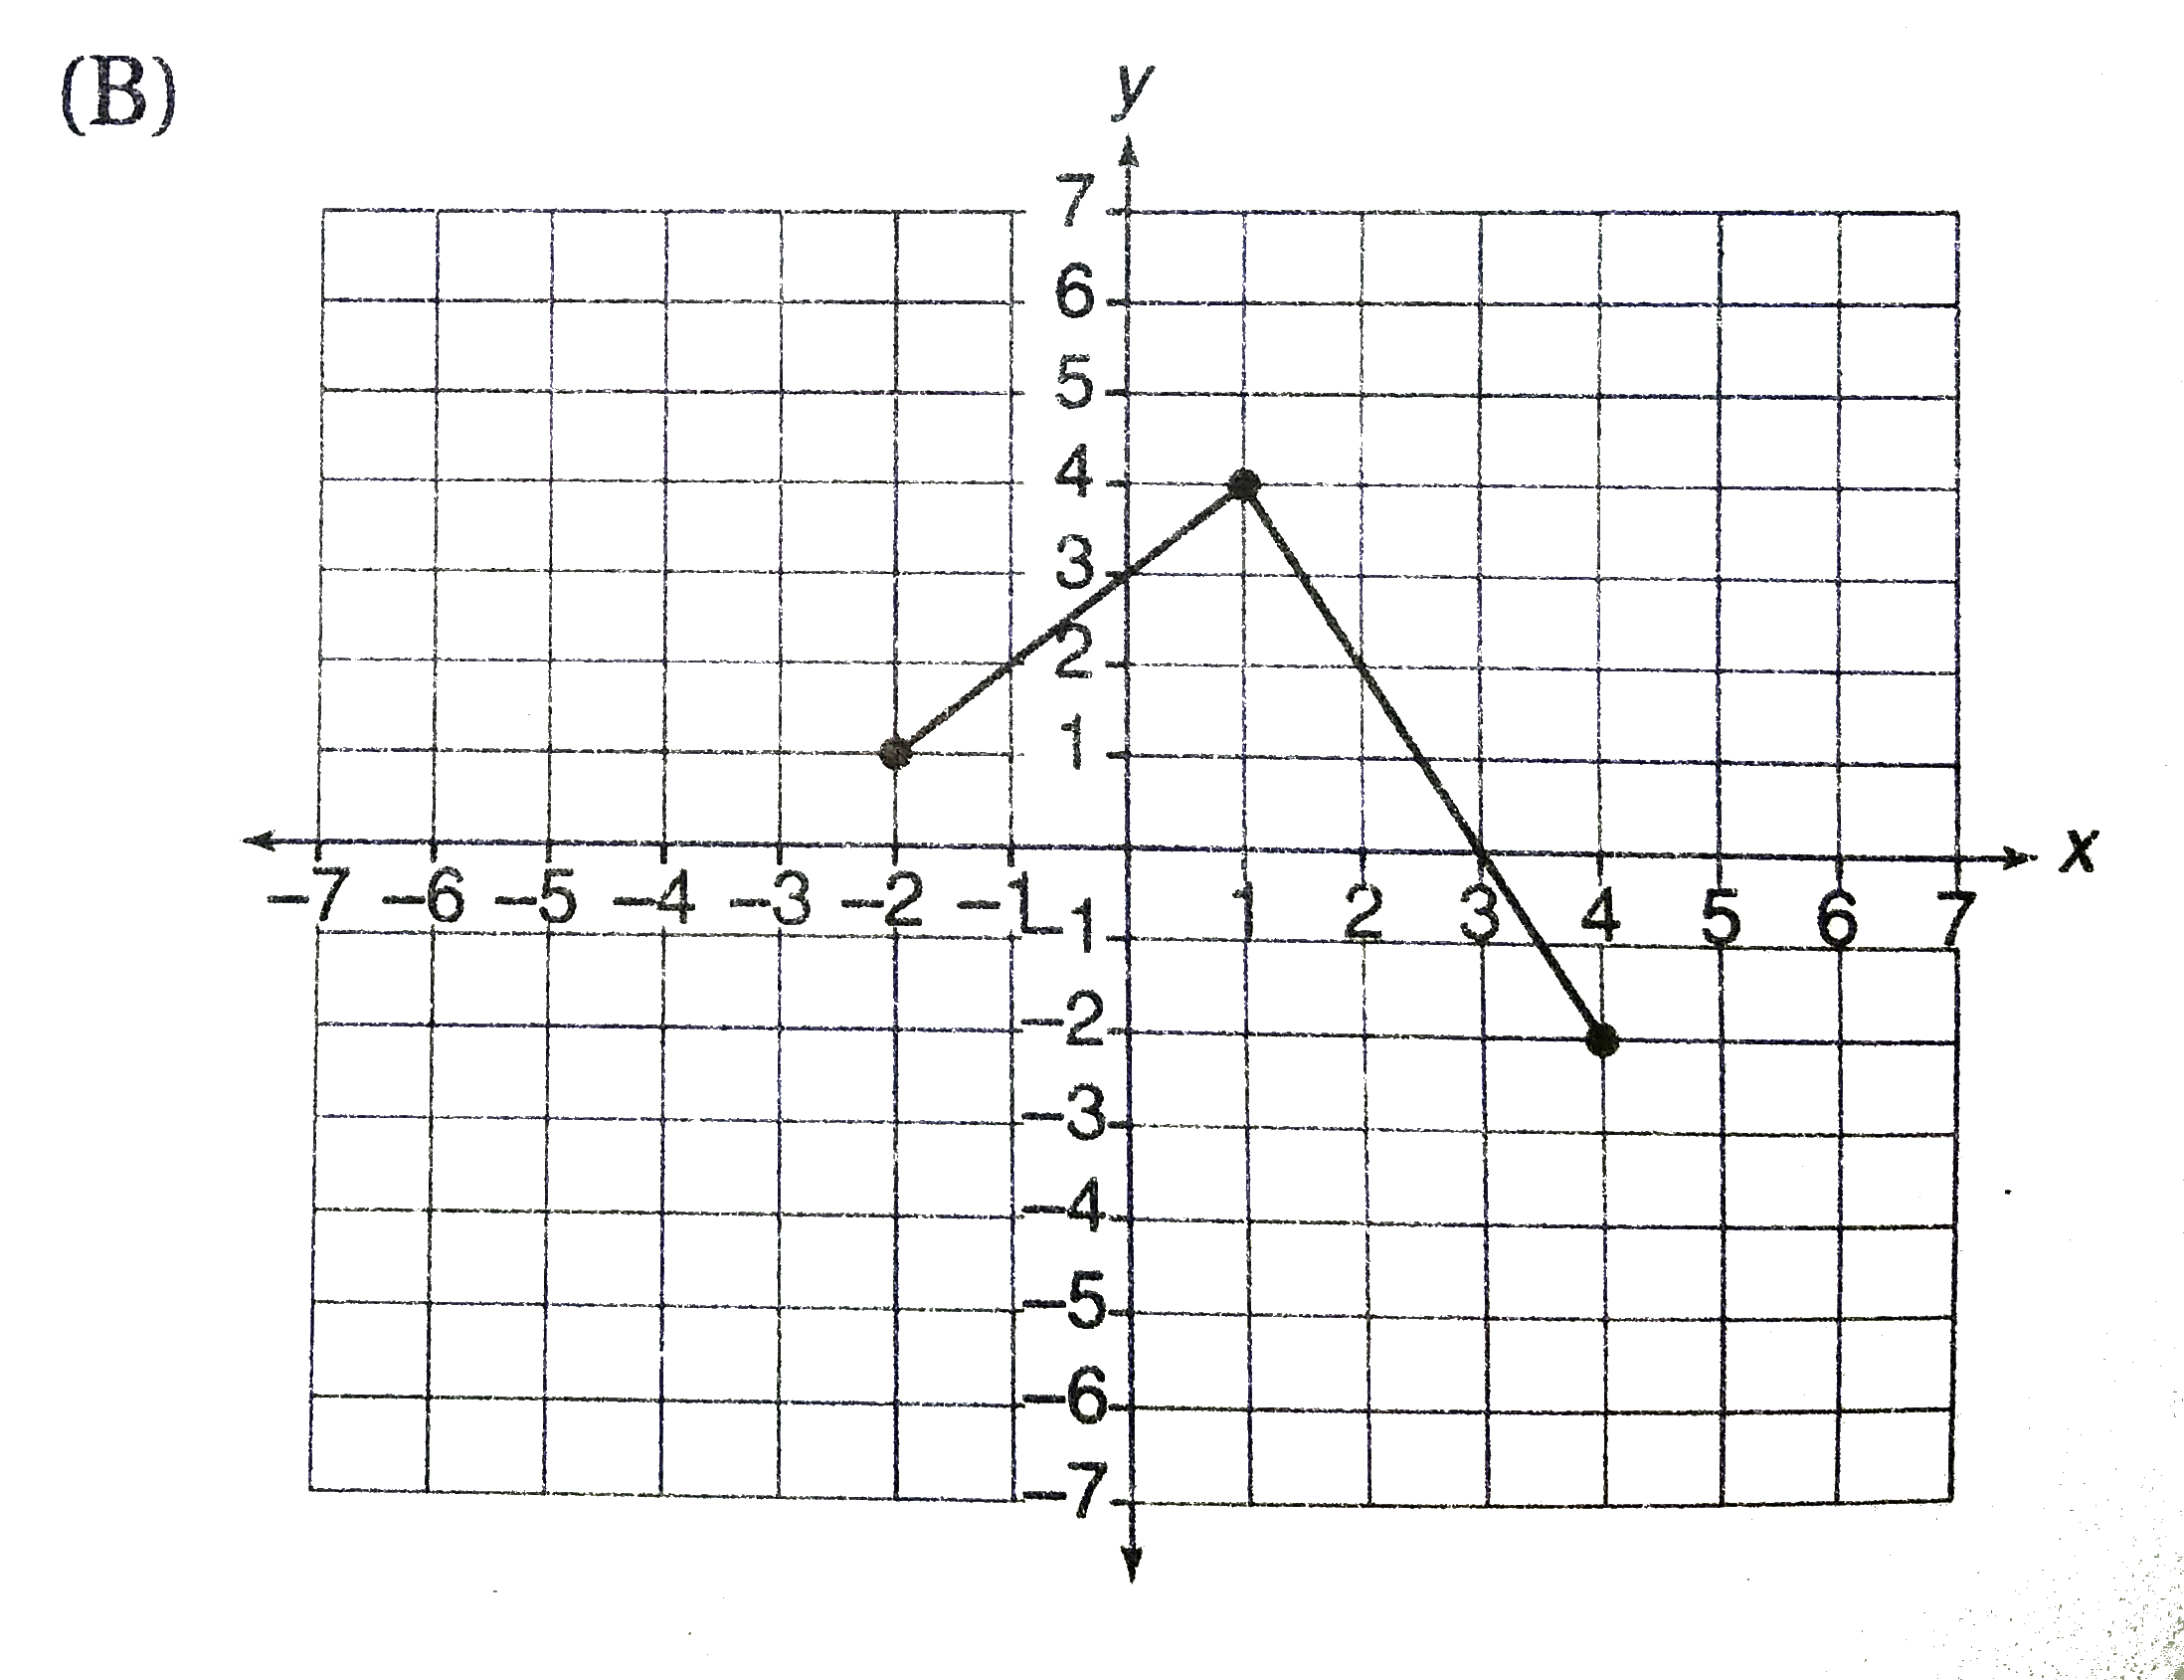
B
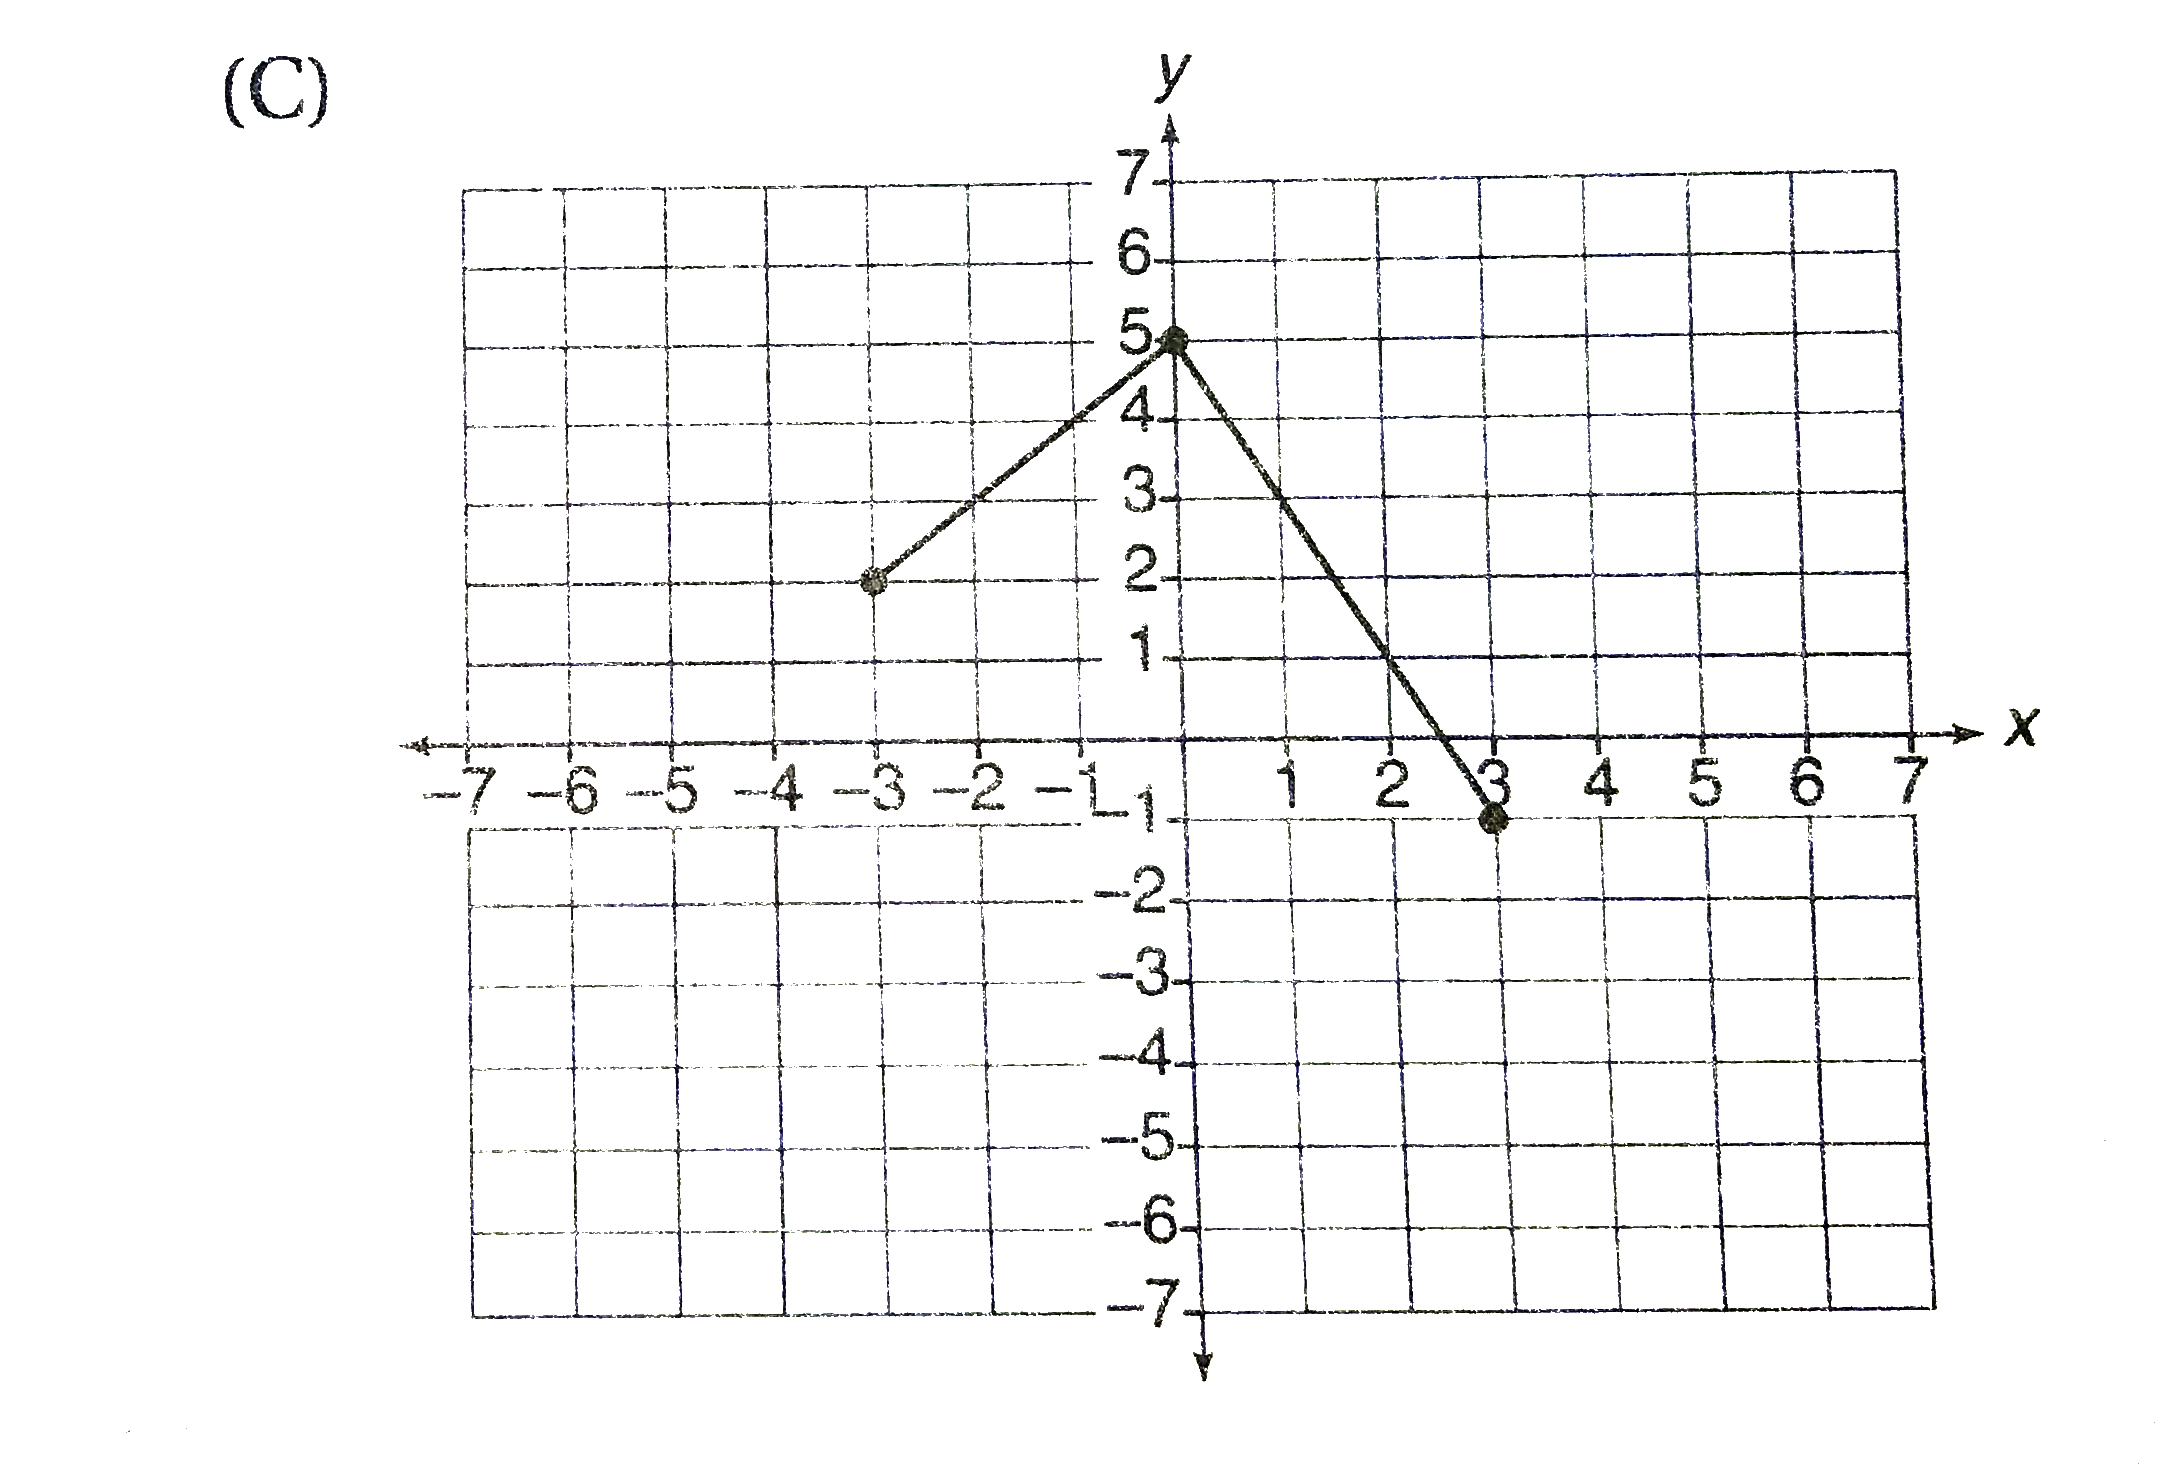
C
D
Text Solution
Verified by Experts
The correct Answer is:


Topper's Solved these Questions
PASSPORT TO ADVANCED MATH
ENGLISH SAT|Exercise Grib-In|29 VideosPASSPORT TO ADVANCED MATH
ENGLISH SAT|Exercise EXERCISE|80 VideosPASSPORT TO ADVANCED MATH
ENGLISH SAT|Exercise EXERCISE|80 VideosPARAMETRIC EQUATIONS
ENGLISH SAT|Exercise EXERCISES|3 VideosPIECEWISE FUNCTIONS
ENGLISH SAT|Exercise EXERCISES|8 Videos
Similar Questions
Explore conceptually related problems
ENGLISH SAT-PASSPORT TO ADVANCED MATH-Multiple Choice
- A system of three equations whose graphs in the xy-plane are a line, a...
Text Solution
|
- Which of the following could be the equation of the graph above?
Text Solution
|
- y=2x^(2)-12x+11 The graph of the equation above is a parabola in the...
Text Solution
|
- f(x)=ax^(2)+bx+c, agt0 The coordinates of the lowest point on the gr...
Text Solution
|
- The parabola whose equation is y=ax^(2)+bx+c passes through the points...
Text Solution
|
- x^(2)+y^(2)=416 y+5x=0 If (x, y) is a solution to the system of eq...
Text Solution
|
- h(t)=-4.9t^(2)+68.6t The function above gives the height of a model ...
Text Solution
|
- The graph of the equation above is a parabola in the xy-plane. If kgt0...
Text Solution
|
- The graph of y=2^(x-3) can obtained by shifting the graph of y=2^(x)?
Text Solution
|
- Which equation represents the line that is the reflection of the line ...
Text Solution
|
- The figure above shows part of the graph of function f. If f(x-5)=f(x)...
Text Solution
|
- The endpoints of overline(AB) are A(0, 0) and B(9, -6). What is an equ...
Text Solution
|
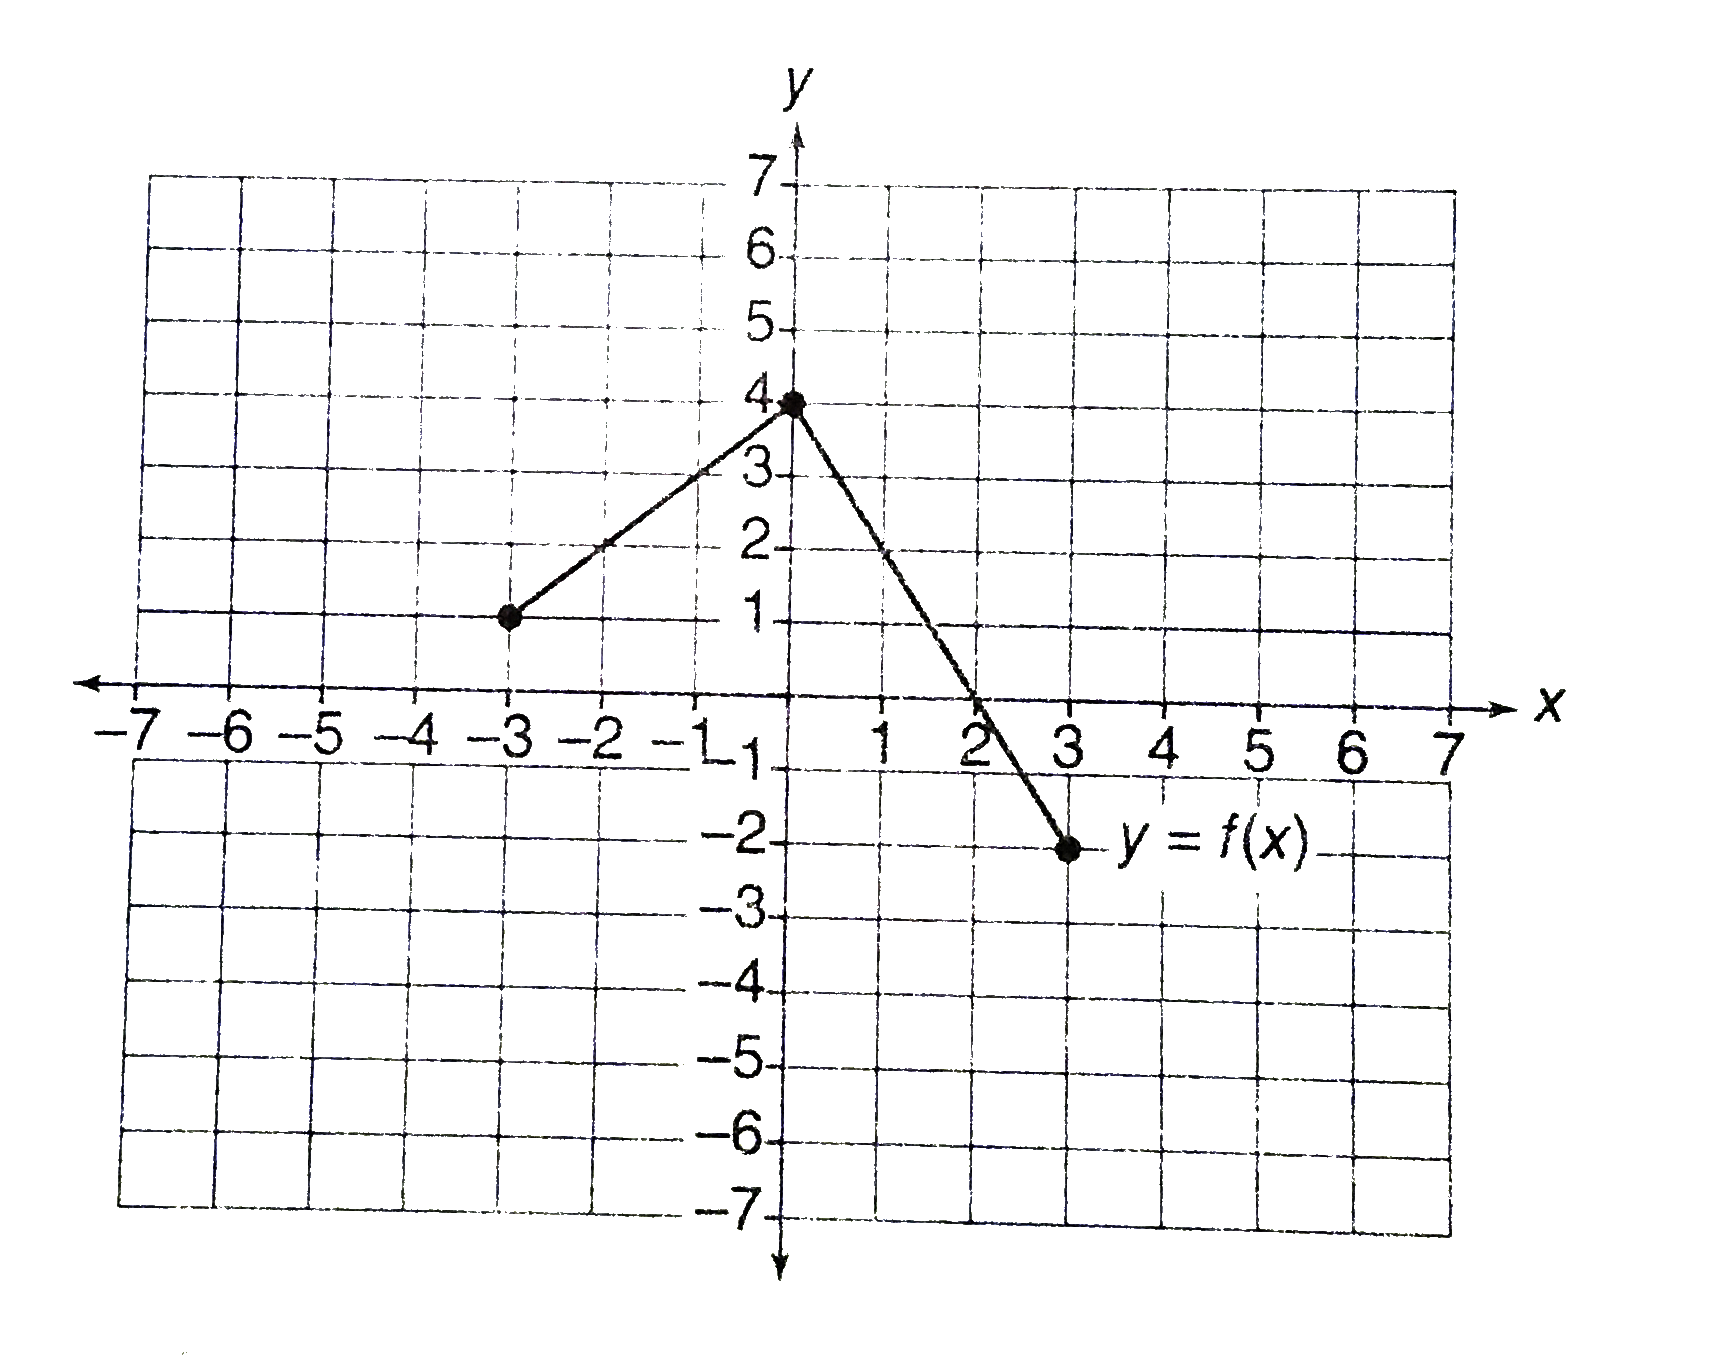
- The figure above shows the graph of function f. If g(x)=-f(x), which g...
Text Solution
|
- The point (2, -1) on the graph y=f(x) is shifted to which point on the...
Text Solution
|
- The accompanying figure shows the graphs of functions f and g. If f is...
Text Solution
|
- If g(x)=-2 intersects the graph of y=f(x)+k at one point, which of the...
Text Solution
|
- If the accomanying figure above shows the graph of function f, which o...
Text Solution
|
- A linear function f is shown in the accompanying figure. If function g...
Text Solution
|
- The graph of y=f(x) is shown below. Which of the following could ...
Text Solution
|
- The graph of the function f is shown above. Which of the following cou...
Text Solution
|