Home
Class 12
MATHS
The histogram above shows the distributi...


The histogram above shows the distribution of 30 test scores. If test score is selected at random, what is the probability that the score falls in the interval that contains the median score?

A

`(4)/(15)`

B

`(2)/(5)`

C

`(1)/(2)`

D

`(3)/(5)`

Text Solution

Verified by Experts

The correct Answer is:
B
Promotional Banner

Topper's Solved these Questions

  • PRACTICE TEST 1

    ENGLISH SAT|Exercise EXERCISE|60 Videos
  • PRACTICE TEST 2 - MATHEMATICS TEST

    ENGLISH SAT|Exercise EXERCISE|60 Videos

Similar Questions

Explore conceptually related problems

The cumulative histrogram above shows the distribution of scores that 24 students received on an English test. If a students is selected at random, what is the probability that the student will have a score between 71 and 80?

The cumulative histogram above shows the distribution of mistakes 28 students in a French languge class made on a test. What is the probability that a student selected at random made more than 10 mistakes?

The same 20 contestants, on each of 3 days, answered 5 questions in order to win a prize. Each contestant received 1 point for each correct answer. The number of contestants receiving a given score on each day is shown in the table above. No contestant received the same score on two different days. If a contestant is selected at random, what is the probability that the selected contestant received a score of 5 on Day 2 or Day 3, given that the contestant received a score of 5 on one of the three days?

A dice is throuwn two times and the total score in two throws is noted. Find the probability that the total score is : 6

A dice is thrown two times and the total score in two throws is noted. Find the probability that the total score is : an even number

A dice is throuwn two times and the total score in two throws is noted. Find the probability that the total score is : at least 6.

The frequency chart shows test scores for a certain class. The total number of student is 31. If a student in the class was picked at random , what is the probability that the student's score was below 71 ?

Two dice are thrown simultaneously. What is the probability obtaining a total score less than 11?

For 20 quiz scores in a typing class, the table below gives the frequency of the scores in each score interval. Which score interval contains the median of the scores?

The diagram above shows a graph of the student's test scores in Ms. Wedow's algebra class. Which ten-point interval contains the median?

ENGLISH SAT-PRACTICE TEST 2-Multiple Choice
  1. If three times 1 less than a number n is the same as two times the num...

    Text Solution

    |

  2. George spent 25% of the money he had on lunch and 60% of the remaining...

    Text Solution

    |

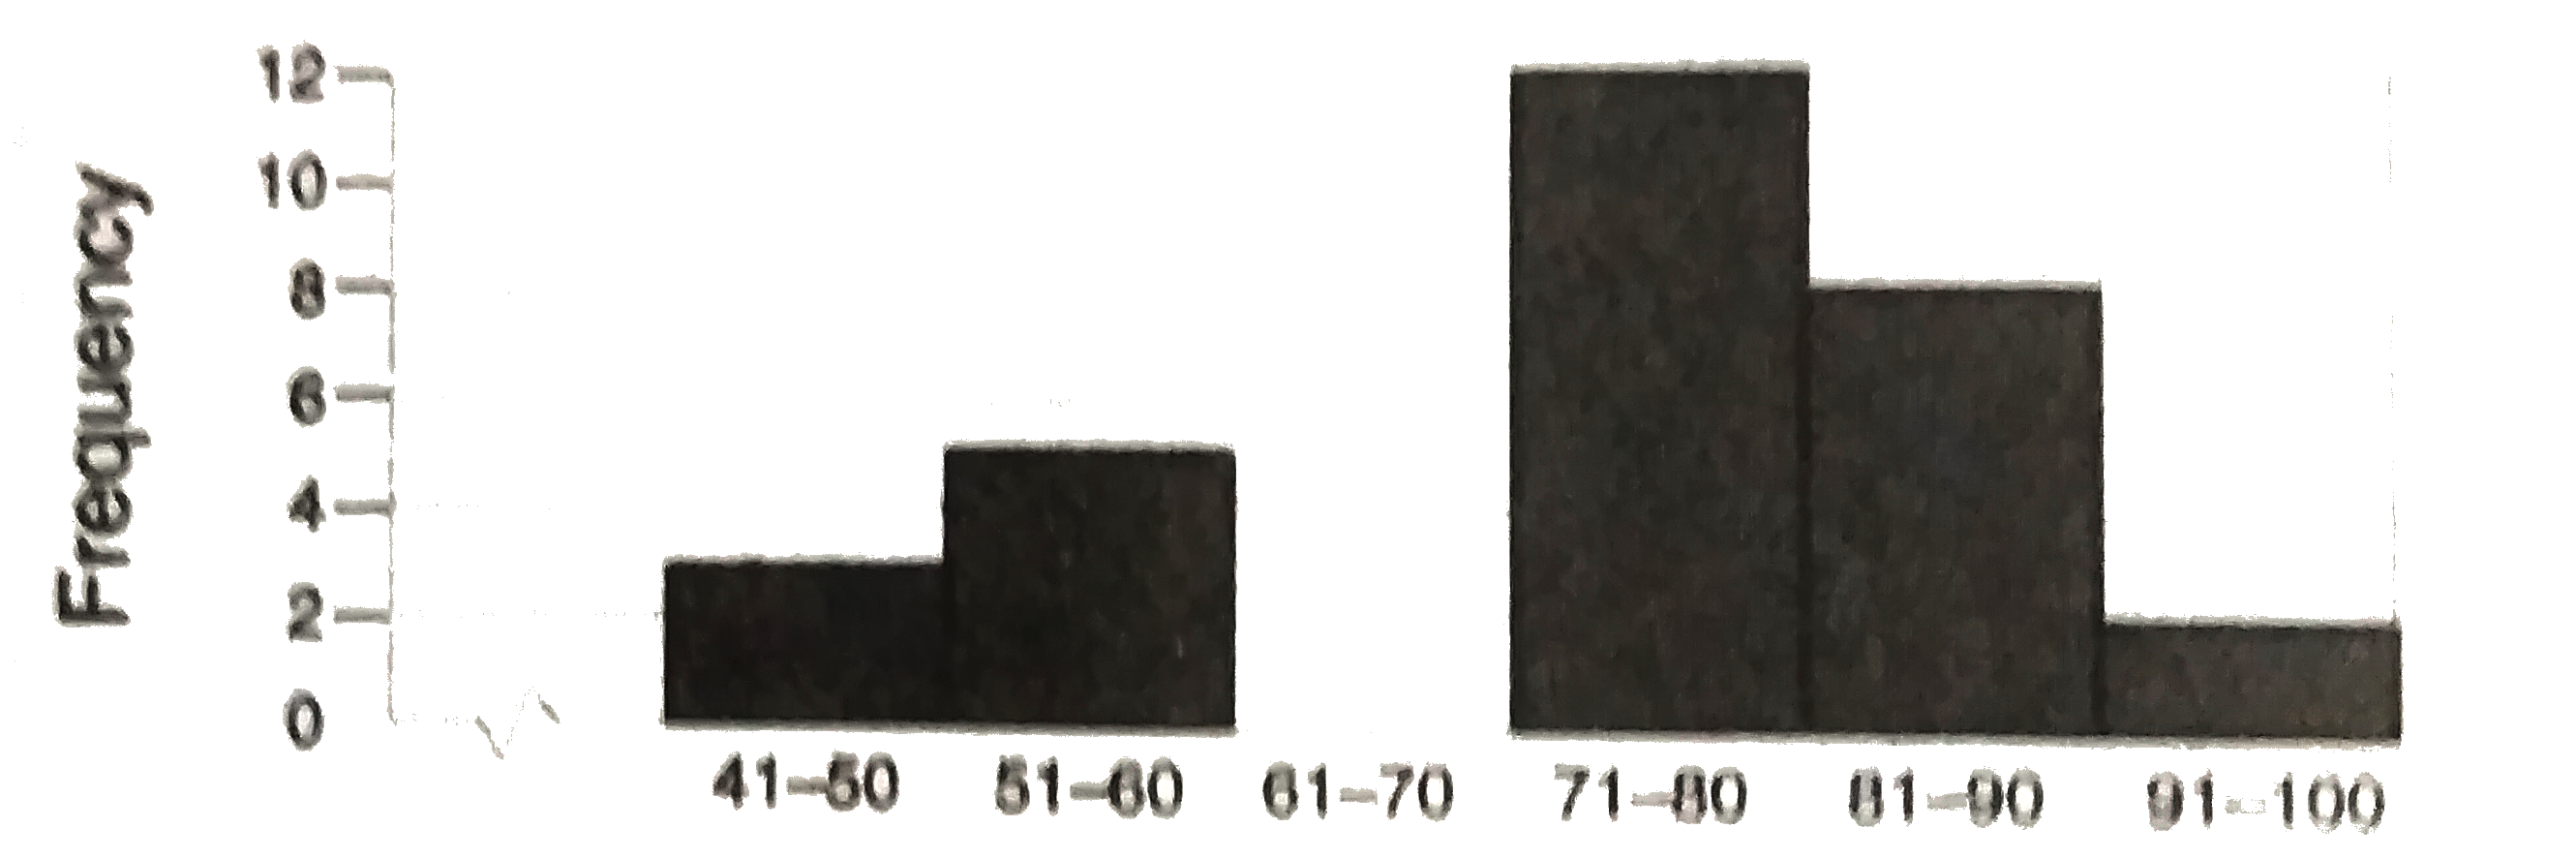
  3. The histogram above shows the distribution of 30 test scores. If test ...

    Text Solution

    |

  4. The breakdown of a 500-milligram sample of a chemical compounds in the...

    Text Solution

    |

  5. Maggie's farm stand sold total of 165 pounds of apples and peaches. Sh...

    Text Solution

    |

  6. A computer program application developer released a new game app to be...

    Text Solution

    |

  7. Which of the four graphs above best shows the relationship between x a...

    Text Solution

    |

  8. An animal boading facility houses 3 dogs for every 2 cats. If the comb...

    Text Solution

    |

  9. An airline flies, two different planes over the same route. The faster...

    Text Solution

    |

  10. x-3y=2y+7 x+2=3(y+1) In the above system of equations, what is the...

    Text Solution

    |

  11. An Ironman Triathlon consist of swimming 2.4 miles, biking 112 miles,a...

    Text Solution

    |

  12. The bottom of a ske slope is 6,500 feet above sea level,the top of the...

    Text Solution

    |

  13. A gardener is planting two types of trees. One type is seven feet tall...

    Text Solution

    |

  14. The table above summarizes the result of a survey taken at the end of ...

    Text Solution

    |

  15. The temperature, t, generated by an electrical circuit is represented ...

    Text Solution

    |

  16. Question 16 and 17 refer to the above table, that shows the population...

    Text Solution

    |

  17. Question 16 and 17 refer to the above table, that shows the population...

    Text Solution

    |

  18. The graph above shows the relationship between a person's weight and t...

    Text Solution

    |

  19. The table above summarizes the result of a survey taken in which 240 a...

    Text Solution

    |

  20. If the sum of 10 dimes, 5 nickels and x quarters equals $5.25, what i...

    Text Solution

    |