A
B
C
D
Text Solution
Verified by Experts
The correct Answer is:


Topper's Solved these Questions
KINEMATICS
PHYSICS GALAXY - ASHISH ARORA|Exercise Numerical|111 VideosKINEMATICS
PHYSICS GALAXY - ASHISH ARORA|Exercise Advance MCQs with One or More Options Correct|17 VideosKINEMATICS
PHYSICS GALAXY - ASHISH ARORA|Exercise Discussion Question|18 VideosGRAVITATION
PHYSICS GALAXY - ASHISH ARORA|Exercise Unsolved Numerical|94 VideosLINEAR MOMENTUM & ITS CONSERVATION
PHYSICS GALAXY - ASHISH ARORA|Exercise exercise 1.3|3 Videos
Similar Questions
Explore conceptually related problems
PHYSICS GALAXY - ASHISH ARORA-KINEMATICS-Conceptual MCQs Single Option Correct
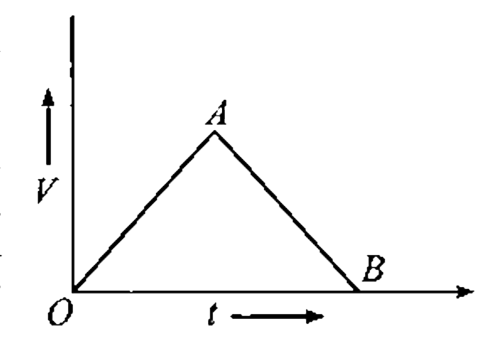
- In the above figure, the portion BC of the curve shows:
Text Solution
|
- Two particles start from rest simultaneously and are equally accelerat...
Text Solution
|
- The following graph shows the speed ofabody which is :
Text Solution
|
- The following figures show some velocity versus time curves. But only ...
Text Solution
|
- The distance travelled by the moving body is :
Text Solution
|
- The diagram shows the velocity-time graph for a particle moving in a s...
Text Solution
|
- Forces proportional to AB, BC & 2 CA act along the sides of triangle A...
Text Solution
|
- A particle moves as shown in the following figure 1.104: From the...
Text Solution
|
- The following figure-1.105 shows the velocity-time graph ofa body. Acc...
Text Solution
|
- A bullet is fired in a horizontal direction from a tower while a stone...
Text Solution
|
- Which graph in the following figure best represents the variation of v...
Text Solution
|
- The variation in the speed of a car during its two hour journey is sho...
Text Solution
|
- A car which has front and rear glass screens almost vertical is moving...
Text Solution
|
- A river is flowing from north to south at a speed of 0.3 kph. A man on...
Text Solution
|
- A time-velocity graph of two vehicles A and B starting from rest at th...
Text Solution
|
- Mark the correct statements :
Text Solution
|
- The force acting on a particle moving along a straight line varies wit...
Text Solution
|
- An object is dropped from rest. Its velocity versus displacement graph...
Text Solution
|
- A stone is dropped from a balloon rising with acceleration a. The acce...
Text Solution
|
- The Figure-1.109 shows the displacement-time graph ofa body subject on...
Text Solution
|