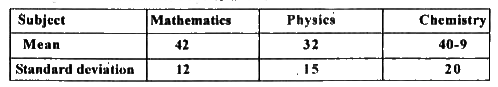
Home
Class 11
MATHS
The mean and standard deviation of marks...

The mean and standard deviation of marks obtained by 50 students of a class in three subjects. Mathematics, Physics and Chemistry are given below.

Which of the three subject shows the highest variability in marks and which shows the lowest ?

Text Solution

Verified by Experts

The correct Answer is:
` = 48.89`
Promotional Banner

Topper's Solved these Questions

  • STATISTICS AND PROBABILITY

    SUBHASH PUBLICATION|Exercise TWO MARKS QUESTIONS WITH ANSWERS|25 Videos
  • SETS

    SUBHASH PUBLICATION|Exercise THREE MARKS QUESETION WITH ANSWERERS|15 Videos
  • STRAIGHT LINES

    SUBHASH PUBLICATION|Exercise FIVE MARKS QUESTIONS WITH ANSWERS|6 Videos

Similar Questions

Explore conceptually related problems

The data regarding marks obtained by 48 students of a class in a class test is given below. Calculate the modal marks of students.

Marks scored by 30 students of 10th standard in unit test of mathematics is given below. Find the variance of the scores:

Observe this bar graph which shows the marks obtained by Aziz in half-yearly examination in different subjects. Answer the answer the given questions. ( c) Name the subject in which he has secored minimum marks.

A class has 175 students. The following data shows the number of students obtaining one or more subjects . Mathematics 100 , Physics 70 , Chemistry 40 , Mathematics and Physics 30 , Mathematics and Chemistry 28 , Physics and Chemistry 23 , Mathematics , Physics and Chemistry 18. How many students have offered Mathematics alone ?

Given below is a cumulative frequency distribution showing the marks secured by 50 students of a class: Form the frequency distribution table for the above data

In a class of 55 students, the number of students studying different subjects are 23 in Mathematics, 24 in Physics, 19 in Chemistry, 12 in Mathematics and Physics, 9 in Mathematics and Chemistry, 7 in Physics and Chemistry and 4 in all the three subjects. Find the number of students who have taken exactly one subject.

In class of 175 students the following data shows the number of students opting one or more subjects. Mathmatics 100, Physics 70 , Chemistry 40, Mathematics and Physics 30 , Mathematics and Chemistry 28, Physics and Chemistry 23, Mathematics , Physics and Chemistry 18 , The number of students who have opted Mathematics along is :

All the students of a class performed poorly in Mathematics. The teacher decided to give grace marks of 10 to each of the students. Which of the following statistical measures will not change even after the grace marks were given ?

In a survey of 200 students of a school, it was found that 120 study Mathematics, 90 study Physics and 70 study Chemistry , 40 study Mathematics and Physics, 30 study Physics and Chemistry, 50 study Chemistry and Mathematics and 20 none of these subjects. Find the number of students who study all the three subjects.

SUBHASH PUBLICATION-STATISTICS AND PROBABILITY -TWO MARKS QUESTIONS WITH ANSWERS
  1. Find the mean deviation about the mean.

    Text Solution

    |

  2. Compute the mean deviation about the mean for the following data.

    Text Solution

    |

  3. Compute the mean deviation about the mean for the following data.

    Text Solution

    |

  4. Find the M.D. about mean

    Text Solution

    |

  5. Compute the mean deviation about the mean for the following data.

    Text Solution

    |

  6. Compute the mean deviation about the mean for the following data.

    Text Solution

    |

  7. Find the mean for the following data :

    Text Solution

    |

  8. Find variance and standard deviation for the following data

    Text Solution

    |

  9. Find the mean and standard deviation using short - cut method.

    Text Solution

    |

  10. Find variance and standard deviation for the following data

    Text Solution

    |

  11. Find the mean and variance for the following frequency distributions

    Text Solution

    |

  12. Find variance and standard deviation for the following data

    Text Solution

    |

  13. The coefficient of variation for a distribution is 60 and standard dev...

    Text Solution

    |

  14. An analysis of monthly wages paid to the workers of two firms A and B ...

    Text Solution

    |

  15. From the data given below state which group is more variable, A or B ?

    Text Solution

    |

  16. From the prices of shares X and Y below, Find out which is more stable...

    Text Solution

    |

  17. The mean and variance of 7 observations are 8 and 16 respectively. If ...

    Text Solution

    |

  18. The mean and variance of 7 observations are 8 and 16 respectively. If ...

    Text Solution

    |

  19. The mean and standard deviation of six observation are 8 and 4 respect...

    Text Solution

    |

  20. The mean and standard deviation of marks obtained by 50 students of a ...

    Text Solution

    |