Home
Class 11
CHEMISTRY
A graph was plotted between molar conduc...

A graph was plotted between molar conductivity of various electrolytes (NaCl, HCl and `NH_4OH`) and `sqrtC` (in mol`L^(-1)`) . Correct set is :

A

I(NaCl),II(HCl) , III(`NH_4OH`)

B

I(HCl),II(NaCl) , III(`NH_4OH`)

C

I(`NH_4OH`), II(NaCl), III(HCl)

D

I(`NH_4OH`), II(HCl) , III(NaCl)

Text Solution

Verified by Experts

The correct Answer is:
B
Promotional Banner

Topper's Solved these Questions

  • ELECTROCHEMISTRY

    NARENDRA AWASTHI|Exercise Level 1 (Q.1 To Q.30)|1 Videos
  • ELECTROCHEMISTRY

    NARENDRA AWASTHI|Exercise Level 1 (Q.91 To Q.120)|1 Videos
  • DILUTE SOLUTION

    NARENDRA AWASTHI|Exercise Level 3 - Match The Column|1 Videos
  • GASEOUS STATE

    NARENDRA AWASTHI|Exercise Level 3 - Subjective Problems|1 Videos

Similar Questions

Explore conceptually related problems

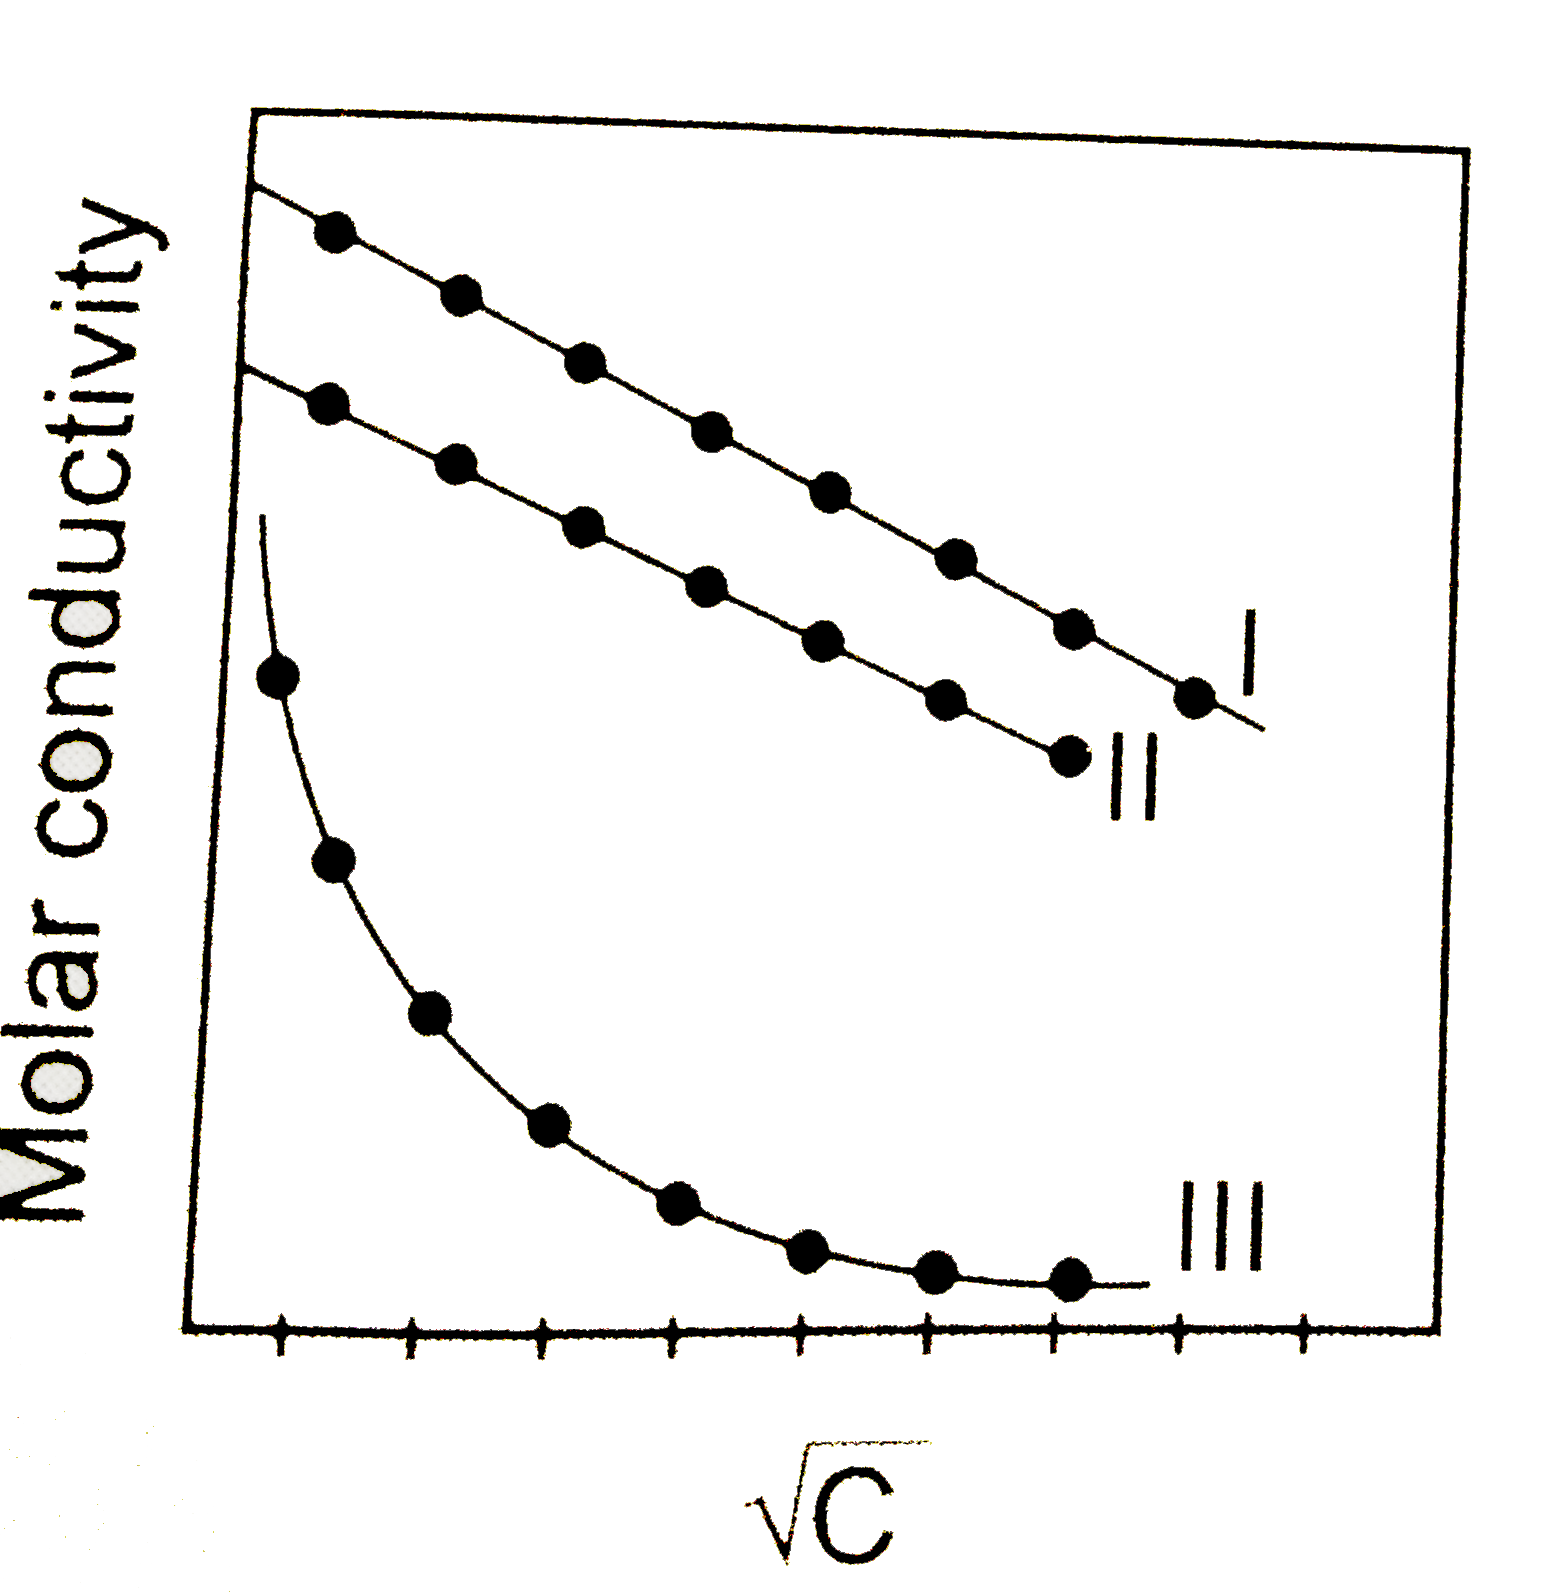
A graph was plotted between the molar conductance of various electrolytes (HCI, KCI and CH_(3)COOH) and root of their concentrations in molar per litre. Which of the following is correct match?

Molar conductivity of NH_4OH can be calculated by the equation.

Limiting molar conductivity of NH_4 OH I e., Lambda_m (NH_4 OH) is equal to .

Molar conductance Lamda_(m) is plotted against sqrt(C) (mol "litre"^(-1) ) for three electrolytes (NaCl, HCl, NH_(4)OH) which of the following is correct ?

Limiting molar conductivity of NH_(4)OH [i.e., Lambda_(m)^(@)(NH_(4)OH) ] is equal to: