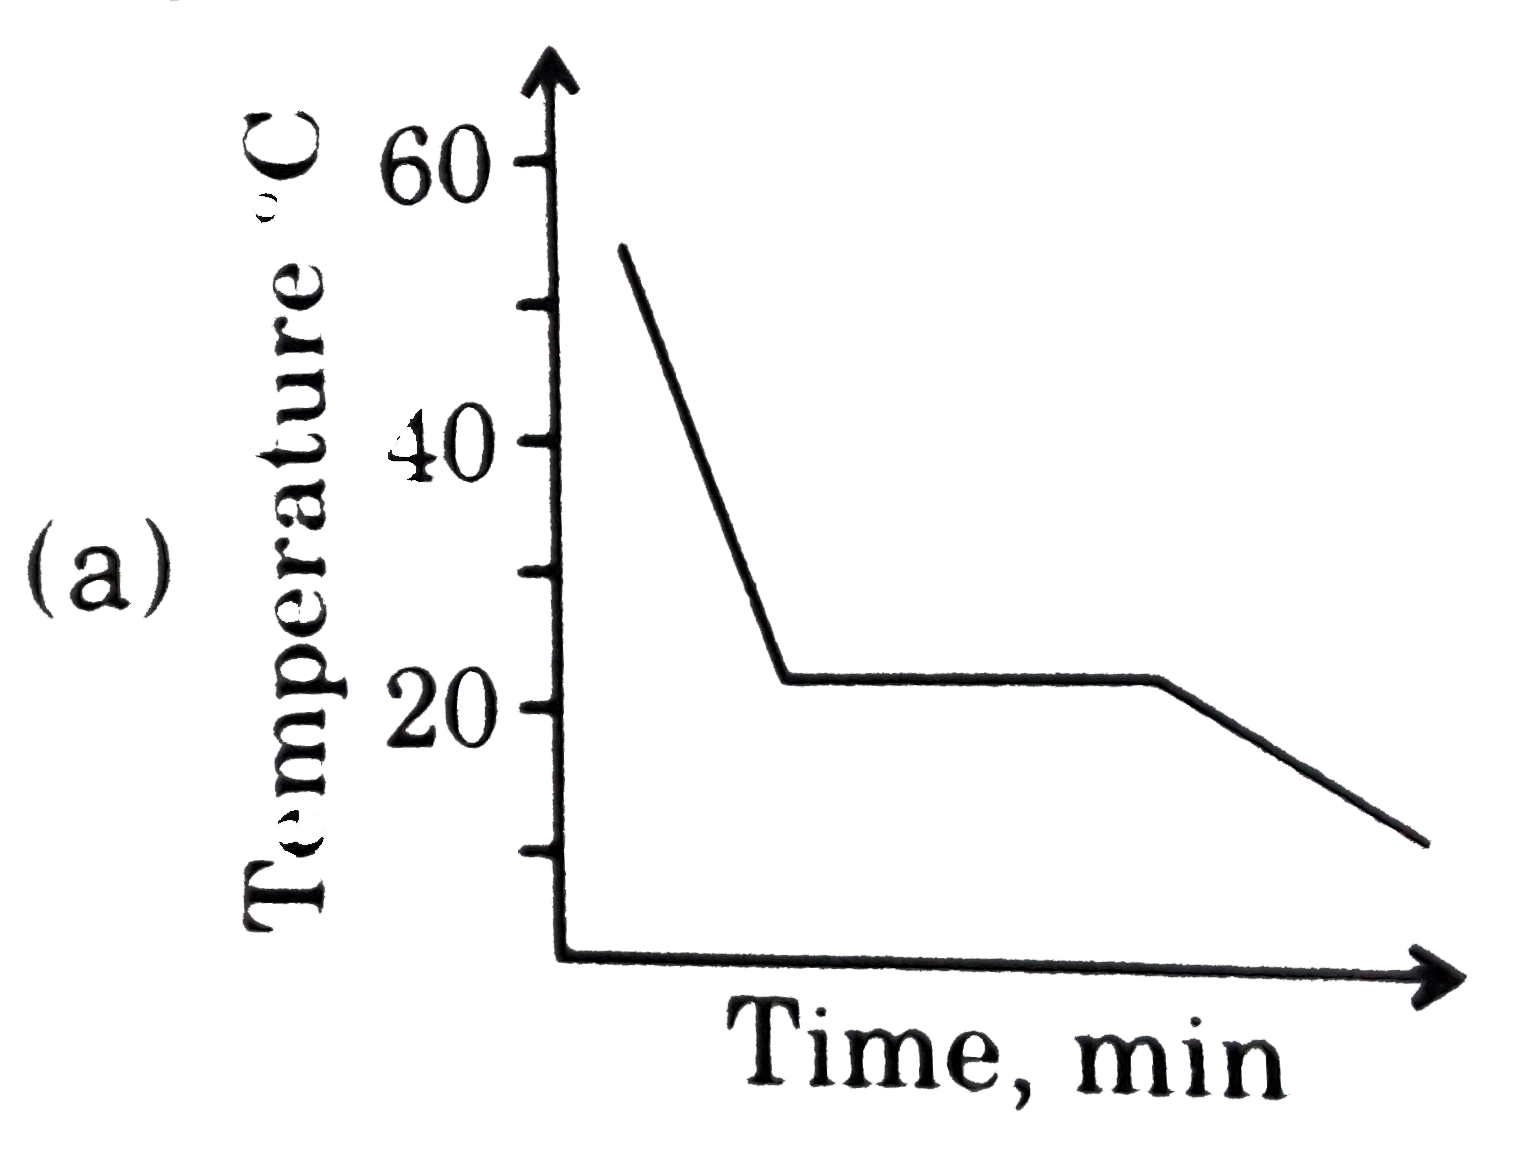
A
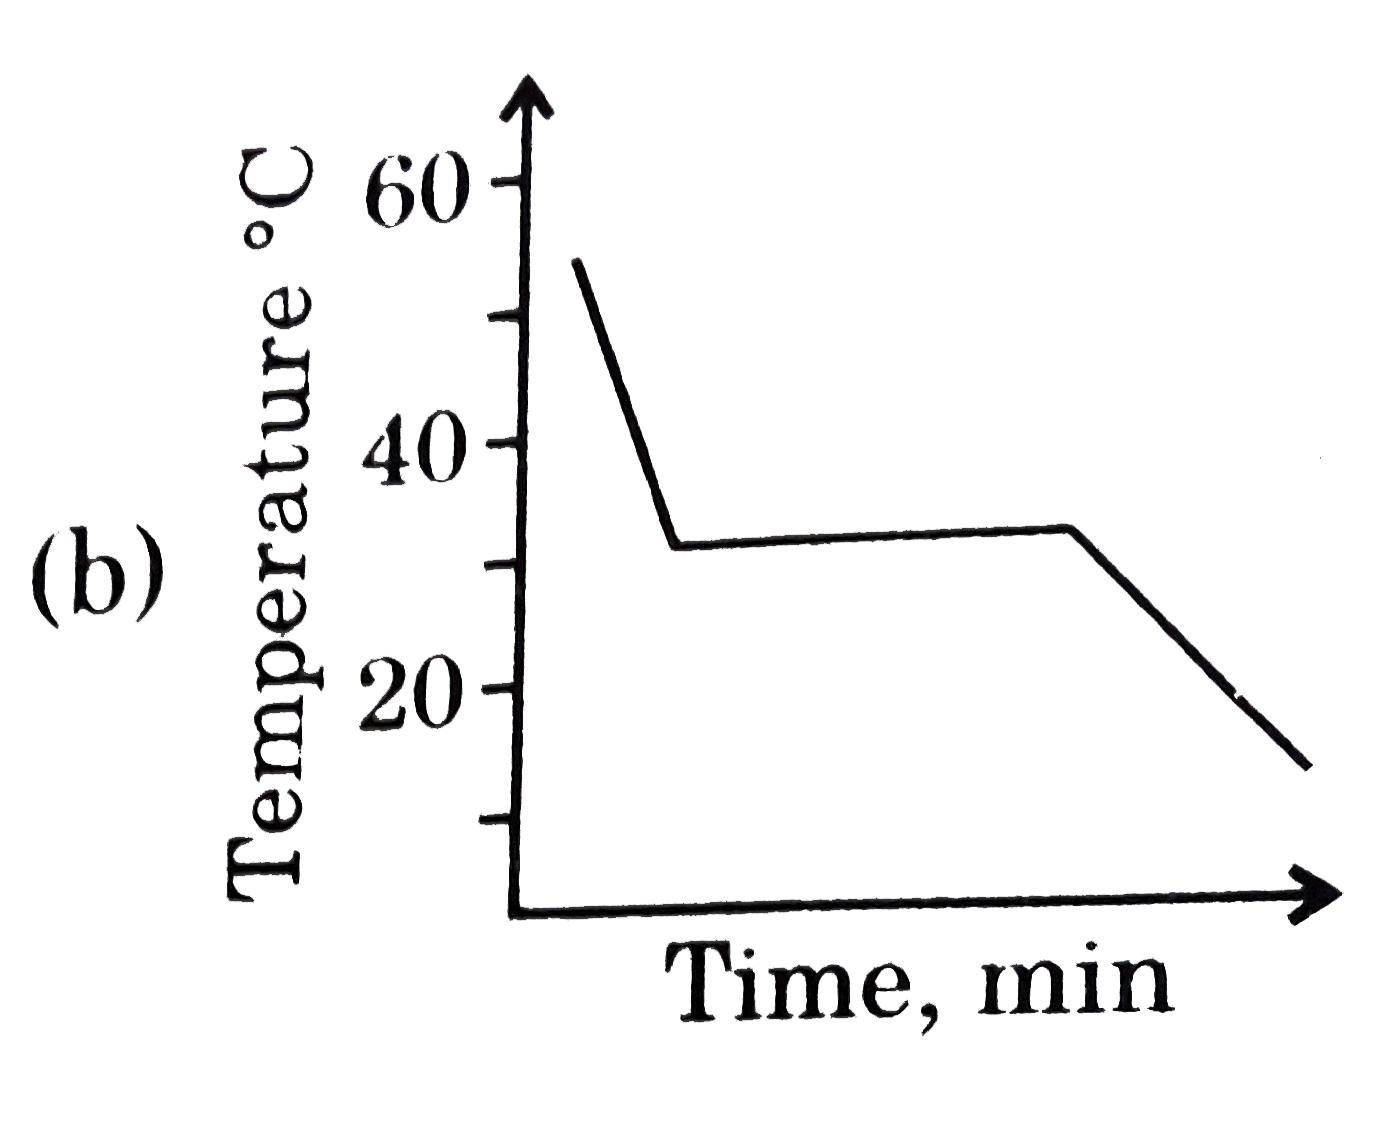
B
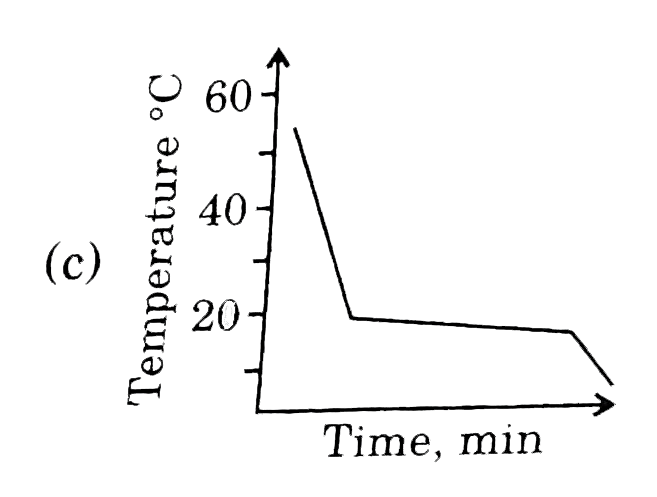
C
D
Text Solution
Verified by Experts
The correct Answer is:


Topper's Solved these Questions
GRAPHICAL INTERPRETATION
GRB PUBLICATION|Exercise E. Surface Chemistry|1 VideosGRAPHICAL INTERPRETATION
GRB PUBLICATION|Exercise Surface Chemistry|4 VideosGRAPHICAL INTERPRETATION
GRB PUBLICATION|Exercise D. Liquid Solutions|1 VideosF-BLOCK ELEMENTS
GRB PUBLICATION|Exercise Subjective type|7 VideosHYDROCARBON (ALIPHATIC)
GRB PUBLICATION|Exercise Previous years jee questions|28 Videos
Similar Questions
Explore conceptually related problems
GRB PUBLICATION-GRAPHICAL INTERPRETATION-Liquid Solutions
- The plots of (1)/(x(A)) (on y-axis) (1)/(y(A)) (on x-axis) is linear w...
Text Solution
|
- A graph showing variation of osmotic pressure (pi) versus molar concen...
Text Solution
|
- Solubility curves of four ionic salts X,Y,Z,W are given below. In whic...
Text Solution
|
- Observe the P-T phase diagram for a given substance A. Then melting po...
Text Solution
|
- Assuming the formation of an ideal solution, determine the boiling poi...
Text Solution
|
- Given P-X curve for a non-ideal liquid mixture (fig). Identify the co...
Text Solution
|
- HNO(3) is more volatile than water. If an aqueous solution of HNO(3) ...
Text Solution
|
- Graph of ln S^(@) vs (1)/(T) is plotted for two gases A and B [S^(@) r...
Text Solution
|
- The phase diagrams for the pure solvent (solid lines) and the solution...
Text Solution
|
- What is the normal boiling point of the solution represented by the ph...
Text Solution
|
- What is the normal freezing point of the solution represented by the p...
Text Solution
|
- This diagram represents the behaviour of a pure solvent upon cooling. ...
Text Solution
|