A
B
C
D
Text Solution
Verified by Experts
The correct Answer is:


Topper's Solved these Questions
GRAPHICAL INTERPRETATION
GRB PUBLICATION|Exercise I.Electrochemistry|1 VideosGRAPHICAL INTERPRETATION
GRB PUBLICATION|Exercise Electrochemistry|9 VideosGRAPHICAL INTERPRETATION
GRB PUBLICATION|Exercise H. Chemical Kinetics|1 VideosF-BLOCK ELEMENTS
GRB PUBLICATION|Exercise Subjective type|7 VideosHYDROCARBON (ALIPHATIC)
GRB PUBLICATION|Exercise Previous years jee questions|28 Videos
Similar Questions
Explore conceptually related problems
GRB PUBLICATION-GRAPHICAL INTERPRETATION-Chemical Kinetics
- Which of the following graph is correct for disporportionation of H(2)...
Text Solution
|
- For a first order reaction: A(3) rarr 3A, Following graph is observed ...
Text Solution
|
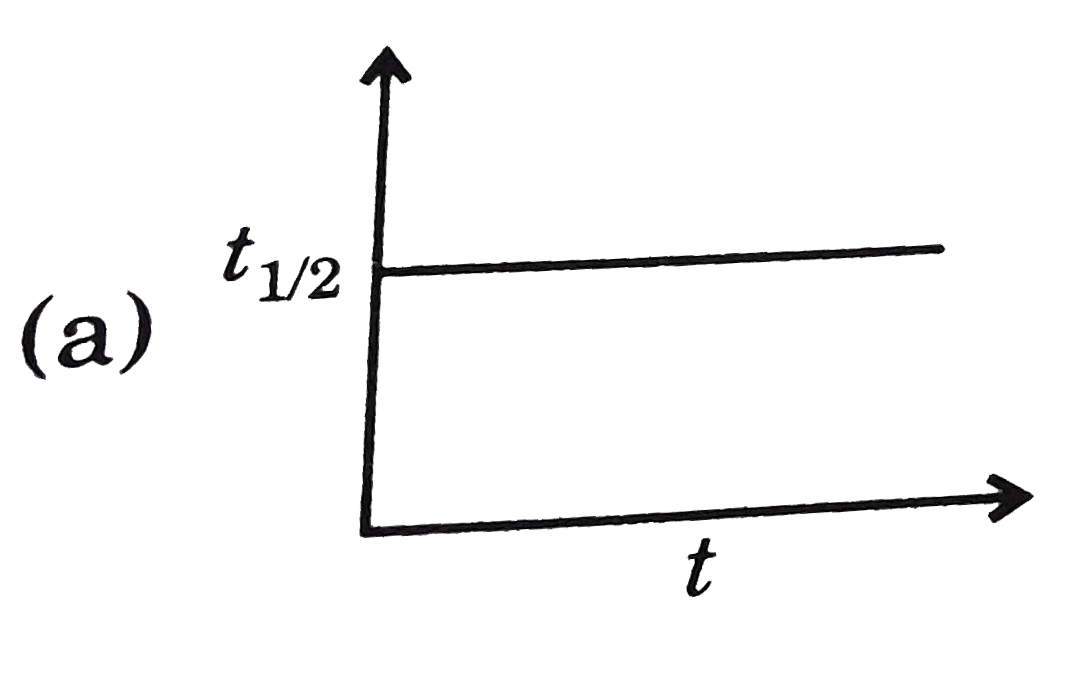
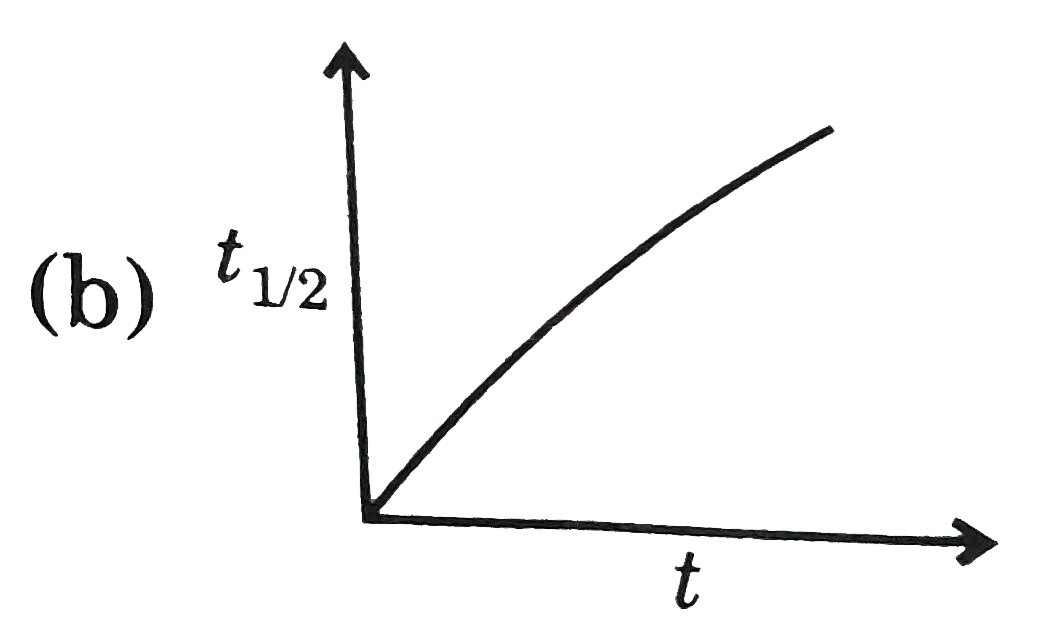
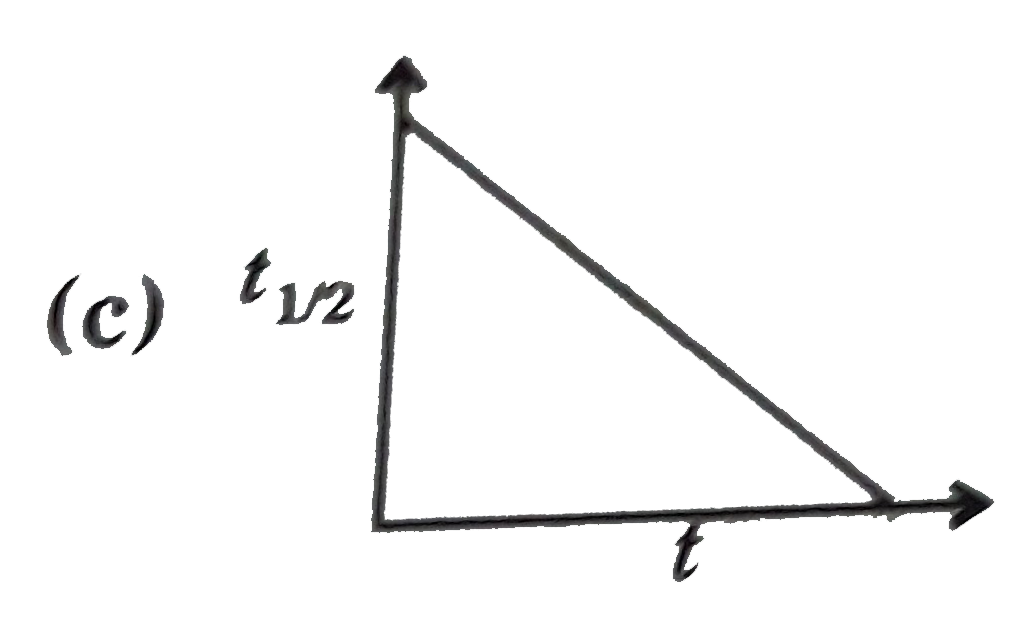
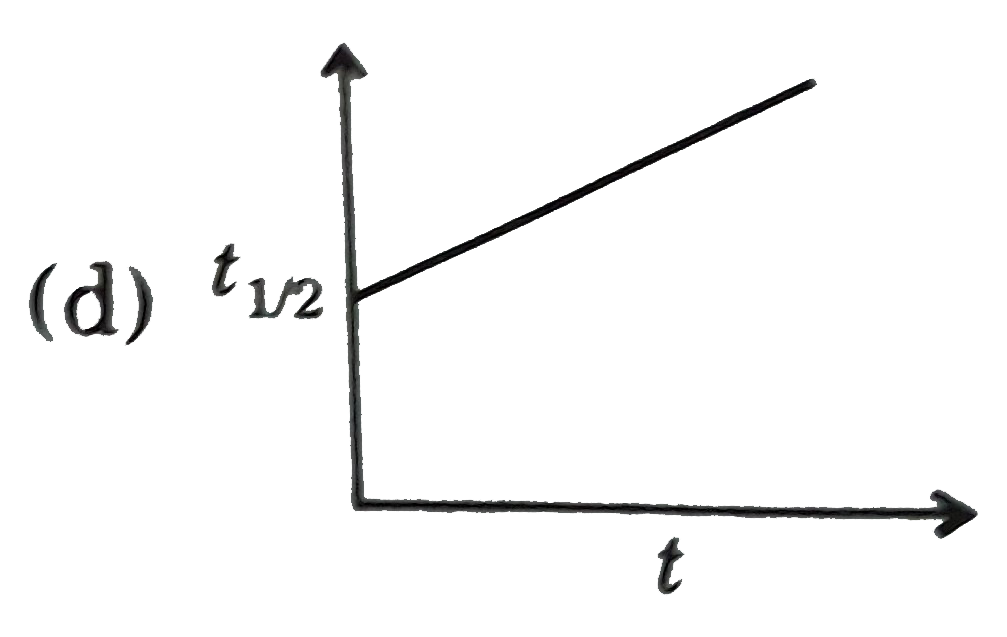
- Which of the following graph is correct w.r.t half life for a zero ord...
Text Solution
|
- For a reaction A rarr Product, a graph plotted between (1)/([A]^(2)) v...
Text Solution
|
- For a reversible factors in forward and backward direction are assumed...
Text Solution
|
- Consider the reaction : A rarr B. The concentration of both reactant a...
Text Solution
|
- The following mechanism has been proposed for the exothermic catalyzed...
Text Solution
|
- For an elementary reaction: nA rarr Product Find the value of n: [wher...
Text Solution
|
- Which of the following graph is incorrect for variation of rate consta...
Text Solution
|
- For a reaction 3A rarr 2B, following graph is obtained, calculate rate...
Text Solution
|
- Consider the first order reaction: A rarr 2B. Which of the following f...
Text Solution
|
- Which of the folloing characteristics are correct for a reaction in wh...
Text Solution
|
- For a reaction A +B rarr C, it is observed that half life of A (when B...
Text Solution
|
- Rate constant vs temperature graph looks like: If the activation energ...
Text Solution
|
- Which of the following graph is incorrect for variation of rate consta...
Text Solution
|
- A reaction follows the given concentration (M) vs time graph. The rate...
Text Solution
|
- For a first order reaction, the reaction, the plot of log C against 't...
Text Solution
|
- The graph between concentration (X) of the Product and time of the rea...
Text Solution
|
- A graph plotted between log t(50%) vs log concentration is a straight ...
Text Solution
|
- What will be the order of reaction and rate constant for a chemical ch...
Text Solution
|