A
B
C
D
Text Solution
Verified by Experts
The correct Answer is:


Topper's Solved these Questions
GRAPHICAL INTERPRETATION
GRB PUBLICATION|Exercise I.Electrochemistry|1 VideosGRAPHICAL INTERPRETATION
GRB PUBLICATION|Exercise Electrochemistry|9 VideosGRAPHICAL INTERPRETATION
GRB PUBLICATION|Exercise H. Chemical Kinetics|1 VideosF-BLOCK ELEMENTS
GRB PUBLICATION|Exercise Subjective type|7 VideosHYDROCARBON (ALIPHATIC)
GRB PUBLICATION|Exercise Previous years jee questions|28 Videos
Similar Questions
Explore conceptually related problems
GRB PUBLICATION-GRAPHICAL INTERPRETATION-Chemical Kinetics
- For a reaction A +B rarr C, it is observed that half life of A (when B...
Text Solution
|
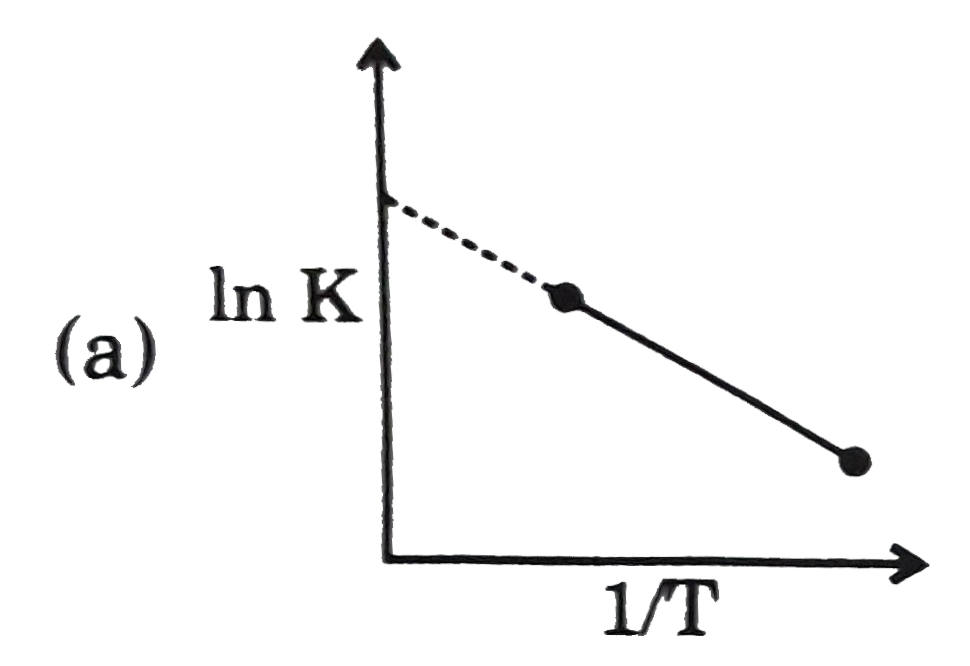
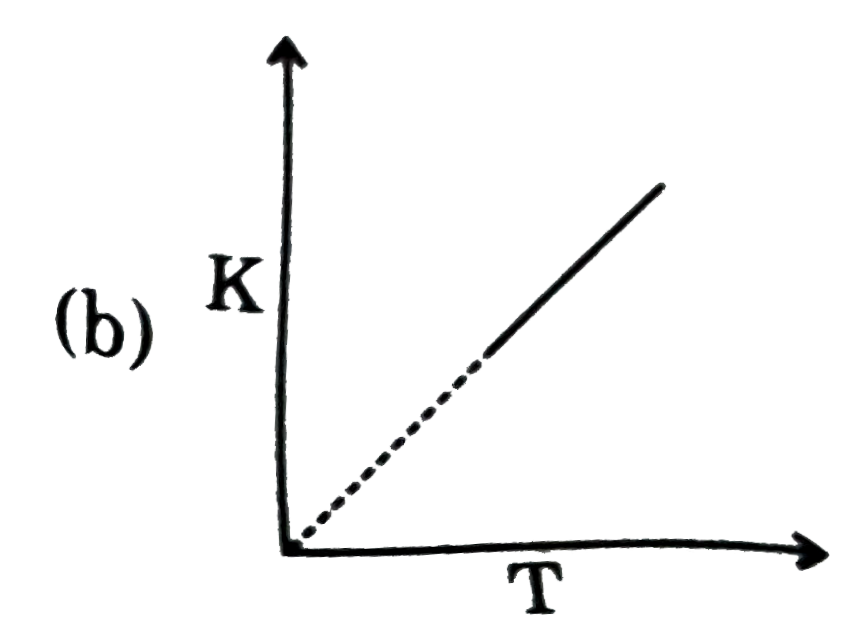
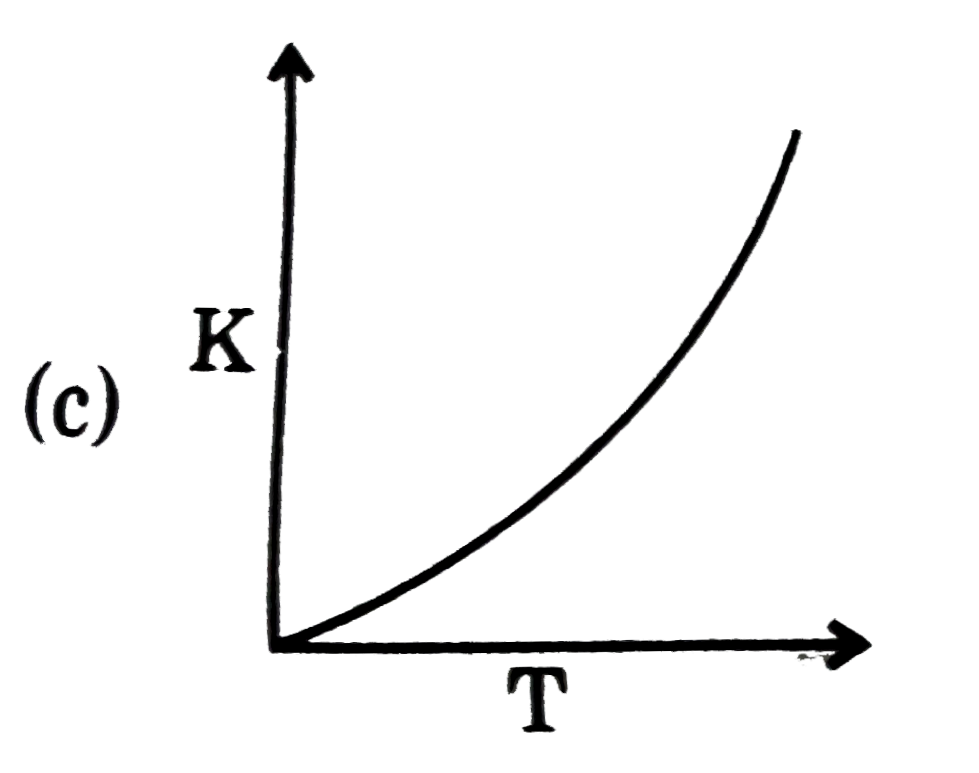
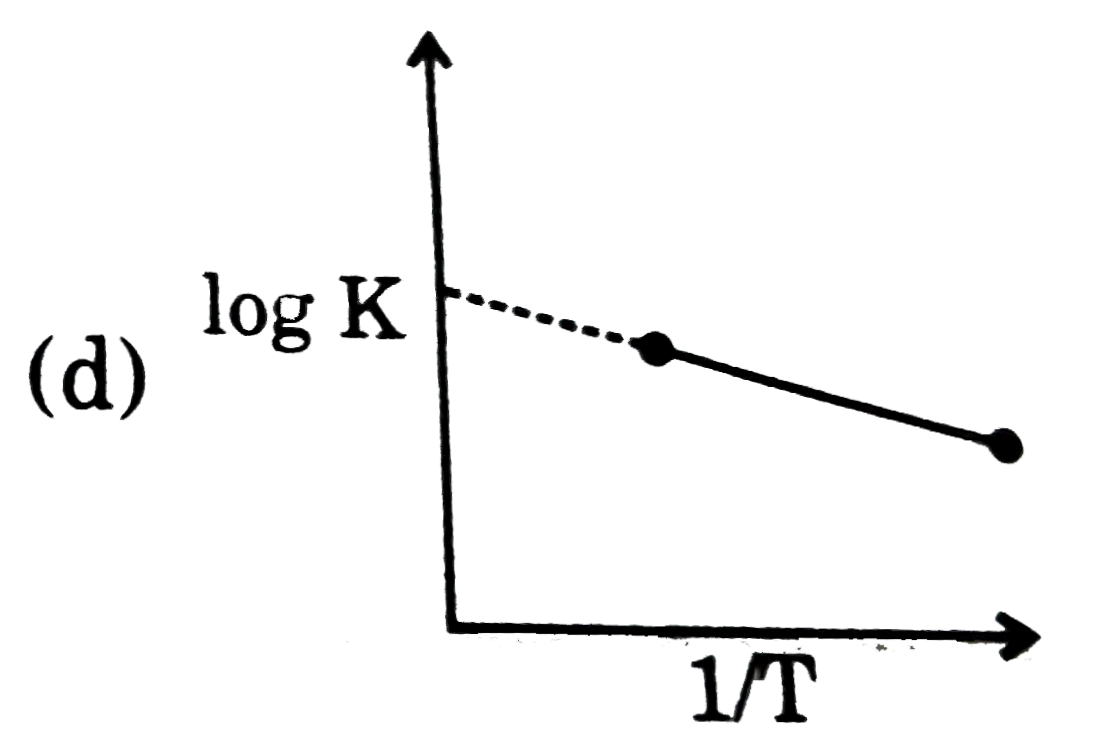
- Rate constant vs temperature graph looks like: If the activation energ...
Text Solution
|
- Which of the following graph is incorrect for variation of rate consta...
Text Solution
|
- A reaction follows the given concentration (M) vs time graph. The rate...
Text Solution
|
- For a first order reaction, the reaction, the plot of log C against 't...
Text Solution
|
- The graph between concentration (X) of the Product and time of the rea...
Text Solution
|
- A graph plotted between log t(50%) vs log concentration is a straight ...
Text Solution
|
- What will be the order of reaction and rate constant for a chemical ch...
Text Solution
|
- A rarr Product and ((dx)/(dt)) = k [A]^(2). If log ((dx)/(dt)) is plot...
Text Solution
|
- In the different reactions, involving a angle reactant in each case, a...
Text Solution
|
- The Arrhenius relationship of two different reactions is shown below. ...
Text Solution
|
- If for a reaction in which A(g) converts to B(g) the reaction carried ...
Text Solution
|
- Rate of reaction A rarr B depends only on A and can be represented by ...
Text Solution
|
- Adjoining graph is for a reaction which have only single reactant (R) ...
Text Solution
|
- The conversion of vinyl allyl ether to pent-4-enol follows first-order...
Text Solution
|
- A simple mechanism for enzyme-catalysed reaction is given by the follo...
Text Solution
|
- In the following graphical representation for the reaction A rarr B th...
Text Solution
|
- Rate law of the reaction A rarr Product is, rate = k[A]. Graphically i...
Text Solution
|
- Which graph is diagnostic of an irreversible second order reaction A r...
Text Solution
|
- For the reaction A rarr B, what is the order with respect to A that gi...
Text Solution
|