A
B
C
D
Text Solution
Verified by Experts
The correct Answer is:


Topper's Solved these Questions
GRAPHICAL INTERPRETATION
GRB PUBLICATION|Exercise I.Electrochemistry|1 VideosGRAPHICAL INTERPRETATION
GRB PUBLICATION|Exercise Electrochemistry|9 VideosGRAPHICAL INTERPRETATION
GRB PUBLICATION|Exercise H. Chemical Kinetics|1 VideosF-BLOCK ELEMENTS
GRB PUBLICATION|Exercise Subjective type|7 VideosHYDROCARBON (ALIPHATIC)
GRB PUBLICATION|Exercise Previous years jee questions|28 Videos
Similar Questions
Explore conceptually related problems
GRB PUBLICATION-GRAPHICAL INTERPRETATION-Chemical Kinetics
- 2NO(2)(g) rarr 2NO(g) +O(2)(g) For the reaction above, a straight line...
Text Solution
|
- From the energy profiles for the two untimolecular reactions below, ho...
Text Solution
|
- In a second order reaction, the plot of 1//(a-x) versus t is a straigh...
Text Solution
|
- This is the rate law for a reaction that consumes X Rate = k[X]^(2) Wh...
Text Solution
|
- Which graph is linear for a reaction that is third order in [A] ?
Text Solution
|
- The value of the specific rate constant, k, for a reaction is determin...
Text Solution
|
- In adjoining diagram depicts the temperature behaviour of the rate con...
Text Solution
|
- The rates of many substrate reaction catalyzed by enzymes vary with ti...
Text Solution
|
- What quantity is represented by the slope of the dashed line in the ac...
Text Solution
|
- A student analyzed tha data from a zero order reaction and obtained th...
Text Solution
|
- Acccording to the reaction profile given, which reaction step is rate-...
Text Solution
|
- Which dimensions in the diagram can be charged.
Text Solution
|
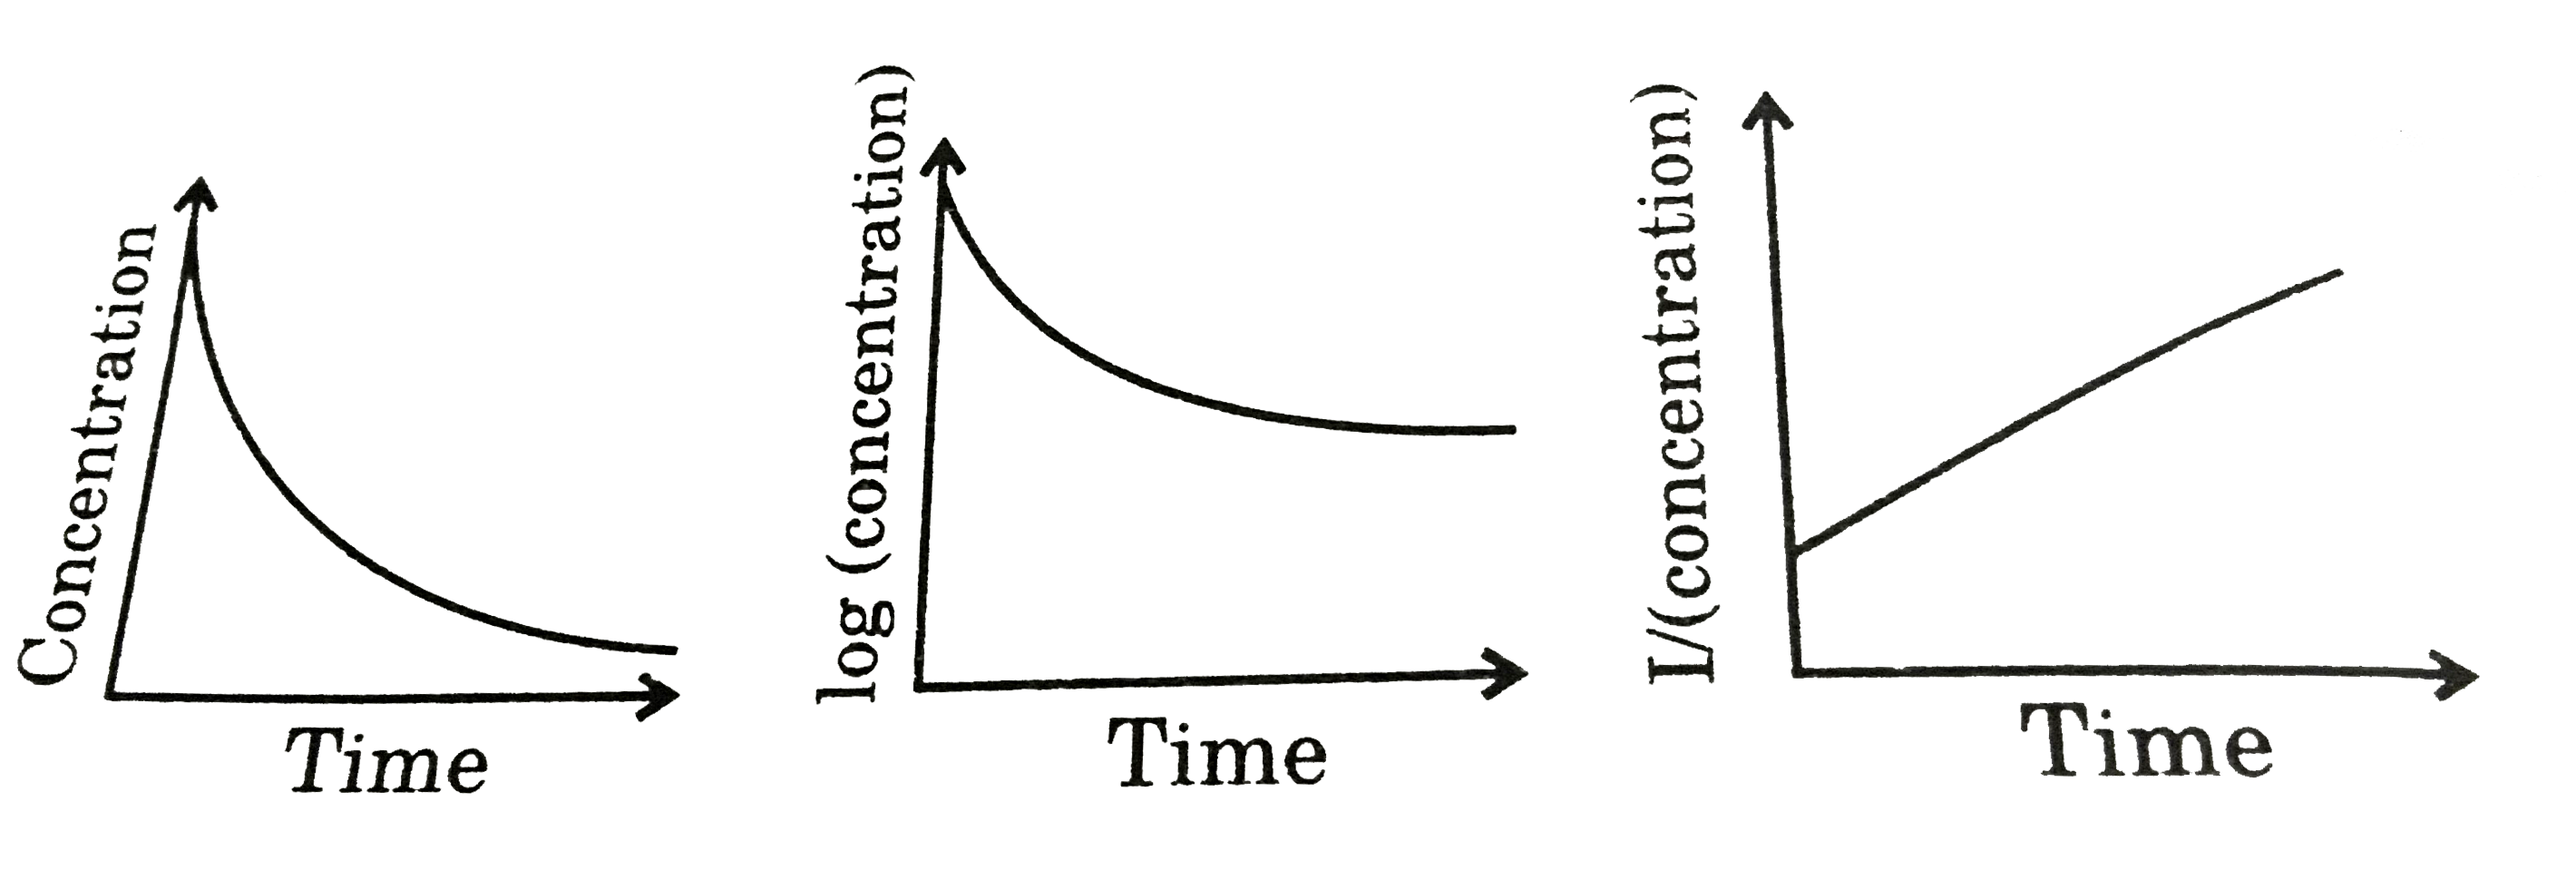
- What is the order of a reaction that produces the graphs shown ?
Text Solution
|
- According to the Arrhenius equation k = Ae^(-E(a)//RT) a plot of ln k ...
Text Solution
|
- Adjoining diagram, represents the energy profile for the reaction : A ...
Text Solution
|
- Curves with the shape shown are often observed for reactions involving...
Text Solution
|
- Which straight line gives the activation energy for a reaction?
Text Solution
|
- A reaction follows the given concentration (M) vs time graph. The rate...
Text Solution
|
- According to the graph what is the rate of disappearance of the reacta...
Text Solution
|
- In the graph the natural log of the vapour pressures of two substances...
Text Solution
|