A
B
C
D
Text Solution
Verified by Experts
The correct Answer is:


Topper's Solved these Questions
GRAPHICAL INTERPRETATION
GRB PUBLICATION|Exercise Comprehension 1|1 VideosGRAPHICAL INTERPRETATION
GRB PUBLICATION|Exercise Comprehension|49 VideosGRAPHICAL INTERPRETATION
GRB PUBLICATION|Exercise Electrochemistry|9 VideosF-BLOCK ELEMENTS
GRB PUBLICATION|Exercise Subjective type|7 VideosHYDROCARBON (ALIPHATIC)
GRB PUBLICATION|Exercise Previous years jee questions|28 Videos
Similar Questions
Explore conceptually related problems
GRB PUBLICATION-GRAPHICAL INTERPRETATION-Multiple Objective Type
- Which of following has correct matching of curve and orbital ?
Text Solution
|
- With refernce to above graph, which of the following is/are incorrect ...
Text Solution
|
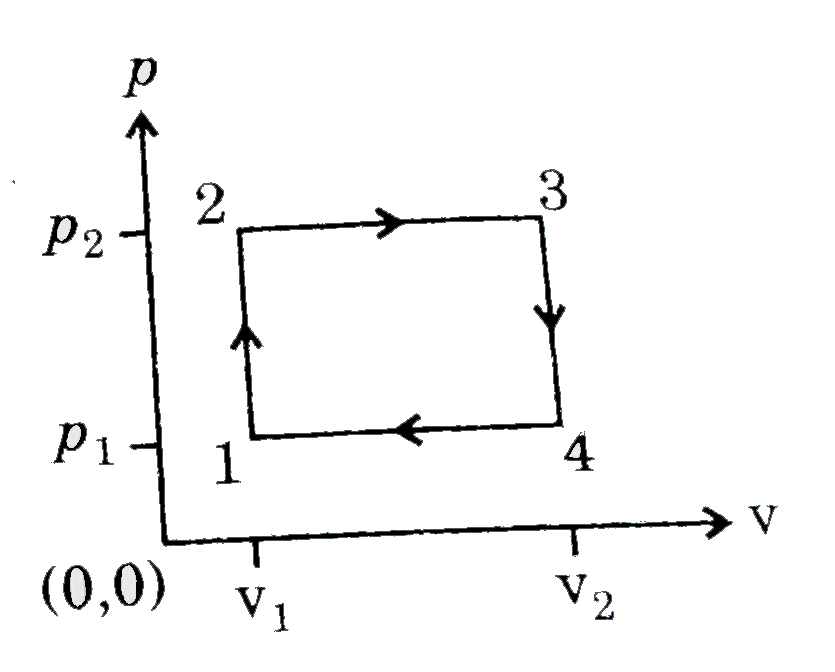
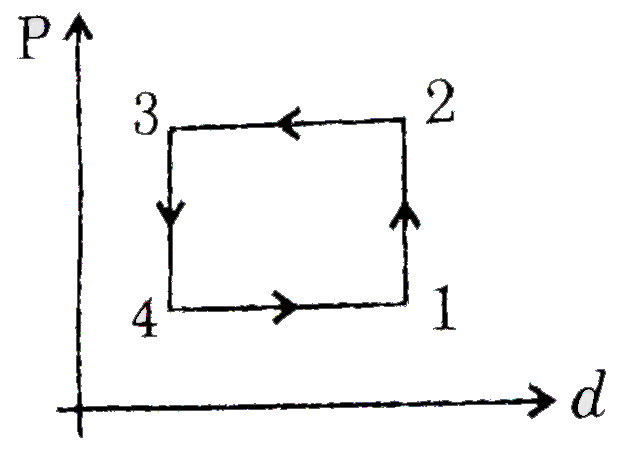
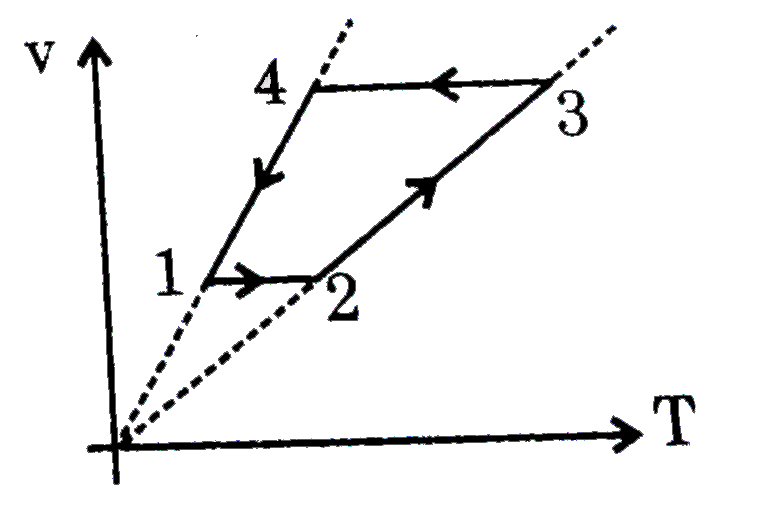
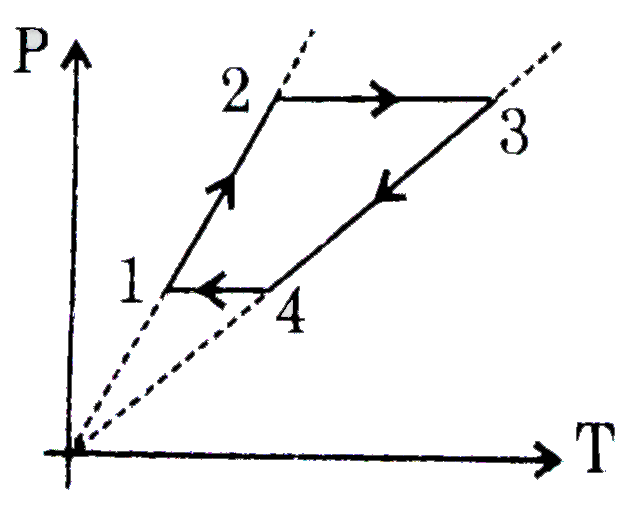
- A gas has been subjected to an isochoric and isobaric cycle. Plot of t...
Text Solution
|
- An ideal gas is taken from the same initial pressure P(1) to the same ...
Text Solution
|
- In the graph showing Maxwell Boltzmann distribution of energy ...........
Text Solution
|
- In a chemical reaction A(g) is converted to B(g) following observation...
Text Solution
|
- For a binary ideal liquid solution, the variation in total vapour pres...
Text Solution
|
- With the help of following phase diagram, select the correct statement...
Text Solution
|
- A 1kg real gas is liquified at temperature 300 K as shown in diagram. ...
Text Solution
|
- For the reaction 2CI F(3)(g) harr CI(2)(g) +3F(2)(g) log K(eq) vs (1...
Text Solution
|
- For the process,
Text Solution
|
- For an irreversible process, if P-V graphs are plotted simply to repre...
Text Solution
|
- Which of the following graphs are correct ?
Text Solution
|
- Which of the following graphs regarding Maxwell distribution of speed ...
Text Solution
|
- For the reaction, A(g) rarr B(g) +C(g) Select the correct graph.
Text Solution
|
- 1 mole N(2)(g) undergoes followingcyclic process : Which option(s) is/...
Text Solution
|
- Which of the following is false regarding reversible adiabatic expansi...
Text Solution
|
- Which of the following are correct ?
Text Solution
|
- Two process are shown such that an ideal gas is taken from state 1 to ...
Text Solution
|
- Which of the following plots is/are correctly labelled ?
Text Solution
|